StudentShare
Contact Us
Sign In / Sign Up for FREE
Search
Go to advanced search...

Descriptive statistics - Assignment Example

Cite this document
Summary
The study will aim at understanding how school counselors use various intervention techniques to promote academic achievement, specifically among the ELL students. In order to better evaluate the intervention techniques, the research will employ hypotheses testing, to determine…
Download full paper File format: .doc, available for editing
GRAB THE BEST PAPER97.7% of users find it useful
Descriptive statistics
Read Text Preview

Extract of sample "Descriptive statistics"

Download file to see previous pages

The study will employ a cross-sectional study where the data will be collected using a well-structured questionnaire administered randomly to both the participating and non-participating ELL students in a bid to compare the academic achievements among both groups. An in-depth interview will be conducted with the school counsellors in a bid to get a deeper understanding of the various interventions techniques implemented. According to Clark and Creswell (2010) one cannot analyze their data with statistics unless the data have been recorded in a numeric form.

The first step therefore will be to assign scores to the different quantitative responses, followed by data entry done using the relevant statistical software or Excel. The research will examine both the single item scores and the summed scores (Clark & Creswell, 2010) as part of its detailed analysis to address the research question, the descriptive statistics obtained will be summarized in tables. Various outputs from the statistical analysis tools will be included as part of the findings. As per Clark and Creswell (2010) the models will be accompanied by the ANOVA and T-test tables in order to provide detailed statistics relevant in testing the differences between the observed grouped in regards to the academic performance.

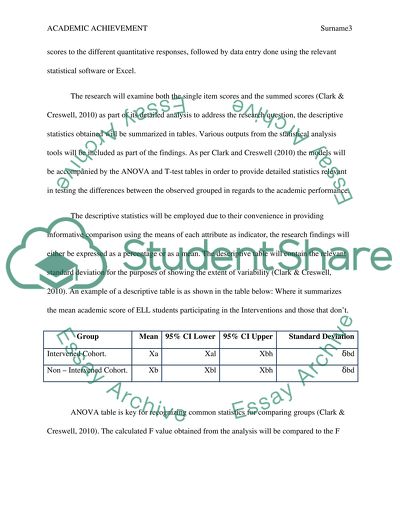
The descriptive statistics will be employed due to their convenience in providing informative comparison using the means of each attribute as indicator, the research findings will either be expressed as a percentage or as a mean. The descriptive table will contain the relevant standard deviation for the purposes of showing the extent of variability (Clark & Creswell, 2010). An example of a descriptive table is as shown in the table below: Where it summarizes the mean academic score of ELL students participating in the Interventions and those that don’t.

ANOVA table is key for

...Download file to see next pages Read More
Cite this document
  • APA
  • MLA
  • CHICAGO
(“Descriptive statistics Assignment Example | Topics and Well Written Essays - 750 words”, n.d.)
Descriptive statistics Assignment Example | Topics and Well Written Essays - 750 words. Retrieved from https://studentshare.org/education/1624784-descriptive-statistics
(Descriptive Statistics Assignment Example | Topics and Well Written Essays - 750 Words)
Descriptive Statistics Assignment Example | Topics and Well Written Essays - 750 Words. https://studentshare.org/education/1624784-descriptive-statistics.
“Descriptive Statistics Assignment Example | Topics and Well Written Essays - 750 Words”, n.d. https://studentshare.org/education/1624784-descriptive-statistics.
  • Cited: 0 times

CHECK THESE SAMPLES OF Descriptive statistics

General statistic

The following report contains study results performed on 100 students of a university, who had been chosen randomly from different areas of the university and were enquired about their ages.... The data was collected has been presented in tabulated form in fig i and fig.... hellip; There are two basic types of data quantitative and qualitative....
5 Pages (1250 words) Statistics Project

Restaurants and Happiness/Life Satisfaction

For any human, satisfaction towards food is an crucial question and issue.... Does a man get proper food?... Is it with right nutritional value?... Is it caters to his satisfaction and worthwhile of money he paid.... Above all, does he get satisfaction ultimately both physically and mentally.... hellip; So there are so many parameters involved in the study of satisfaction towards food....
6 Pages (1500 words) Statistics Project

Phone Calls Made Home by Undergraduate Students

descriptive statistics and the ANOVA table for the sample are available in the appendix of this document.... Since we can assume equal variance, we can use the given F and p statistics given in the between-subjects table.... This paper analyzed the number of phone calls made home by a small sample of undergraduate students....
2 Pages (500 words) Statistics Project

Gross National Income of different countries

n accordance with the descriptive statistics demonstrated in Table 1, the following relation can be ascertained: ... The paper includes the statistics of visitors to the UK and its revenue.... he methods employed are analysis of summary statistics, analysis of frequency table and histogram and the analysis of line graph of Gross National Income....
3 Pages (750 words) Statistics Project

Understanding of the Trends of Voting in the British Population

From the paper "Understanding of the Trends of Voting in the British Population" it is clear that to better understand the voting preferences and attitudes of the British population, a questionnaire is designed to collect political views from a sample of college students.... hellip; An alpha value of ....
7 Pages (1750 words) Statistics Project

Statestic

Life expectancy at birth is the average number of years a newborn infant would live if the health and living conditions at birth remain same throughout its life.... Worldwide life expectancy has risen on average by 4 months each year since 1970.... This case study will analyze whether… Life expectancy at birth is the average number of years a newborn infant would live if the health and living conditions at birth remain same throughout its life....
2 Pages (500 words) Statistics Project

Analyzing the Data Set using Inferential Statistics

The formula for z-test proportions is: , where (sample proportion), n = sample size, p = population proportion, q = 1 – p. ... ... uestions 5 and 6 aim to test estimates for… Thus, we will be using t test in testing our hypotheses (Note, however, that t-test is ideally for a sample size of less than 30....
4 Pages (1000 words) Statistics Project

Secondary study on any current public health issue - Obesity

Obesity has a negative effect on the health leading to impaired health, laziness, unwanted lethargy, etc causing discomfort and importantly major health diseases.... The life is under threat for an over obese person.... It also affects health in worse way leading to absenteeism and… The obesity is mainly based on Body Mass Index which is purely a measure based on Weight and Height of a person....
4 Pages (1000 words) Statistics Project
sponsored ads
We use cookies to create the best experience for you. Keep on browsing if you are OK with that, or find out how to manage cookies.
Contact Us