StudentShare
Contact Us
Sign In / Sign Up for FREE
Search
Go to advanced search...
Free

Statistics - Assignment Example

Cite this document
Summary
In this report, data samples for plastic knob sizes are gathered for analysis. The acceptable range for knob sizes is given as,
Although raw data is…
Download full paper File format: .doc, available for editing
GRAB THE BEST PAPER91% of users find it useful
Statistics
Read Text Preview

Extract of sample "Statistics"

Introduction Statistics is a useful tool in process evaluation more especially in instances where data samples are necessary in analysis. In this report, data samples for plastic knob sizes are gathered for analysis. The acceptable range for knob sizes is given as,0.137" ≤ acceptable ≤ 0.143"Materials and MethodsAlthough raw data is presented in the study, the data was grouped using 0.002 range and their respective frequencies identified. The resulting grouped data was then subjected to statistical analysis.

Manual calculations (using excel) based on formulas was done while excel analysis tool was also used to generate descriptive statistics for the raw data. The result was then compared against each other. Additionally, a further randomly generated data based on the mean and SD for the previous data was generated and its descriptive statistics generated and compared against the previous data. ResultsHistogramThe histogram shows that although the data displays a near-normal distribution, it is slightly skewed to the right.

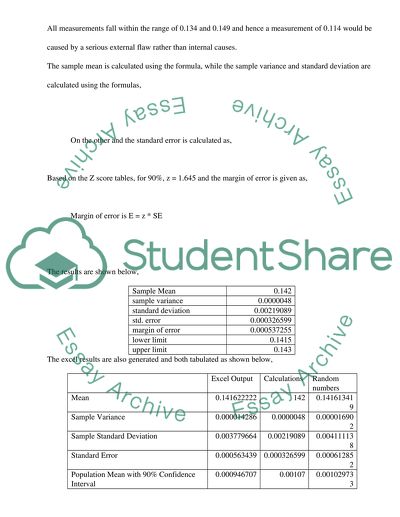
All measurements fall within the range of 0.134 and 0.149 and hence a measurement of 0.114 would be caused by a serious external flaw rather than internal causes.The sample mean is calculated using the formula, while the sample variance and standard deviation are calculated using the formulas, On the other and the standard error is calculated as, Based on the Z score tables, for 90%, z = 1.645 and the margin of error is given as,Margin of error is E = z * SE The results are shown below,Sample Mean0.

142sample variance0.0000048standard deviation0.00219089std. error0.000326599margin of error0.000537255lower limit 0.1415upper limit 0.143The excel results are also generated and both tabulated as shown below,Excel OutputCalculationsRandom numbersMean0.1416222221420.141613419Sample Variance0.0000142860.00000480.000016902Sample Standard Deviation0.0037796640.002190890.004111138Standard Error0.0005634390.0003265990.000612852Population Mean with 90% Confidence Interval0.0009467070.001070.001029733DiscussionMarginal differences are recorded amongst the descriptive statistics generated for the 3 sets of data.

Nonetheless, the results for the excel analysis output are much closer to the results for then generated random numbers; a result of which can be attributed to the fact that the mean and standard deviation used in generation of the random numbers were from the excel analysis results. Nonetheless, the differences can be attributed to seed element included in the generated random numbers. The calculation results are based on the grouped data whereby various assumptions are made. These assumptions potentially produce some marginal areas resulting into the differences.

ConclusionsThe study reveals marginal differences in the approach used in calculation of statistics variables.APPENDIces- Figures and Tables

Read More
Cite this document
  • APA
  • MLA
  • CHICAGO
(“Statistics Assignment Example | Topics and Well Written Essays - 250 words - 3”, n.d.)
Statistics Assignment Example | Topics and Well Written Essays - 250 words - 3. Retrieved from https://studentshare.org/engineering-and-construction/1634057-statistics
(Statistics Assignment Example | Topics and Well Written Essays - 250 Words - 3)
Statistics Assignment Example | Topics and Well Written Essays - 250 Words - 3. https://studentshare.org/engineering-and-construction/1634057-statistics.
“Statistics Assignment Example | Topics and Well Written Essays - 250 Words - 3”, n.d. https://studentshare.org/engineering-and-construction/1634057-statistics.
  • Cited: 0 times

CHECK THESE SAMPLES OF Statistics

Business statistics-----Summarizing Data

s far as employment Statistics are concerned there has been an increase in absolute number of people employed but percentage wise unemployment has risen which is not a good indicator.... According to the report of AMA, we can conclude the following.... From the period of 1980s to 2000 various changes have been noticed in the population structure....
2 Pages (500 words) Statistics Project

Descriptive Statistics Memo

escriptive Statistics for full time enrolments, students per faculty ratio, local tuition, foreign tuition, age, percentage foreigners, GMAT takers, English test takers, work experience and starting salaries have been illustrated in table 2.... We conducted a survey of 25 leading Asia-Pacific schools to determine factors influencing choice of schools, as more and more Asians choose MBA as a route to corporate success....
3 Pages (750 words) Statistics Project

Statistical Analysis of Bank in New Jersey

For this, I will use Asbury Park Press compiled county by county data and summarize this data set using scatter diagram and the descriptive Statistics and presents findings in this memo.... Every Financial institution has a legal and social responsibility to serve all communities and banks are obliged to serve adequately both inner-city and suburban neighborhoods, both poor and wealthy communities....
5 Pages (1250 words) Statistics Project

Statistics assignment

If the Poisson events are occurring at a rate of λ per unit time, then we have fY (y) Statistics 302 Assignment 2 Report written by: Number: ”I confirm that I have not received help from, or given help to, anyone else in constructing thesolution to this assignment”______________________ NameQ1....
2 Pages (500 words) Statistics Project

Business Statistics

Consequently, this has generated competition in the business sector hence bringing competition.... Furthermore, for business entities to survive in highly competitive… Advertisement refers to a system of communication that dissimilar organizations use in encouraging and conversing with people to support or buy their goods and services....
2 Pages (500 words) Statistics Project

Statistics Assignment

The alternative hypothesis H1 is that perceived quality of merchandise is a determining factor of store image for shoppers at speciality stores than at discount stores, since it is a true hypothesis and the claim is to be a true one whereas the null hypothesis is that the… The minor problem may be due to the expected frequency of Unspecified for male is less than 5....
5 Pages (1250 words) Statistics Project

Statistics and Data Interpretation

he data is provided separately as an Excel spreadsheet entitled 4BBY1060: Statistics and Data Interpretation This work is worth 10% of the module marks Using MS Word, or clear hand-writing, enter your answers to questions in the spaces provided.... Complement the numerical Statistics with a graphical display: From the MABP increase values, construct a grouped frequency table for the whole class, showing the frequency and percentage frequency at 5 mmHg intervals....
1 Pages (250 words) Statistics Project

Statistics questions

One blue and one red marble can be drawn in two ways.... That is a blue marble on the first draw and a red marble on the second draw or a red marble on the first draw and a blue marble on the second draw.... Therefore, ... ... 3.... This is a case of permutation.... Assuming no member can… d more than one position, a president can be selected from 19 members, a vice president can be selected from remaining 18 members, a secretary can be selected from remaining 17 members and a treasurer can be selected from remaining 16 members....
3 Pages (750 words) Statistics Project
sponsored ads
We use cookies to create the best experience for you. Keep on browsing if you are OK with that, or find out how to manage cookies.
Contact Us