StudentShare
Contact Us
Sign In / Sign Up for FREE
Search
Go to advanced search...
Free

Financial analysis of Morrisons and comparison with Tesco - Coursework Example

Cite this document
Summary
One of the most famous ways to analyze the performance of an organization is to analyze its financial statements and calculate various financial ratios.The ratios can be analyzed over a period of time and compared to other companies in the same industry…
Download full paper File format: .doc, available for editing
GRAB THE BEST PAPER91.7% of users find it useful
Financial analysis of Morrisons and comparison with Tesco
Read Text Preview

Extract of sample "Financial analysis of Morrisons and comparison with Tesco"

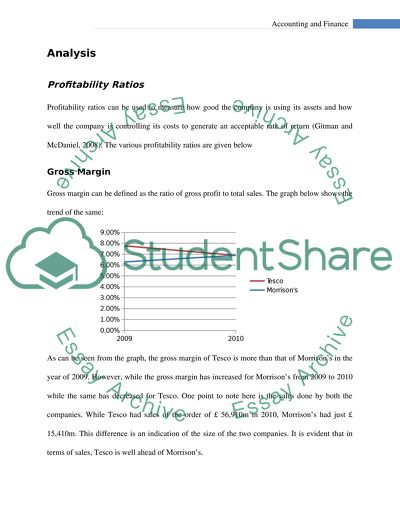
?College Accounting and Finance Financial analysis of Morrison’s and comparison with Tesco Submitted Introduction One of the most famous ways to analyze the performance of an organization is to analyze its financial statements and calculate various financial ratios. The ratios can be analyzed over a period of time and compared to other companies in the same industry. Ratio analysis of an organization presents facts on a comparative basis and enables the drawing of inference regarding the performance of a firm (Khan & Jain, 2006). This analysis gives a useful indication of the performance of the organization. Financial ratios are often used by shareholders, bankers, trade creditors, analysts, management and the general public at large to measure the performance of the company in various aspects such as liquidity, profitability, debt and market position (Stoltz et al., 2007). However, these ratios often should be analyzed keeping in mind the accounting policies and the principles used by companies and is dependent on the industries under consideration (Siegel and Shim, 2006). The objective of this report is to analyze the performance of Morrison’s. In order to do this, ratios will be calculated for the company over a period of two years: 2009 and 2010. The ratios will be compared to Tesco which is a leading competitor in the same industry. Four categories of ratio will be calculated for both the companies: 1. Profitability 2. Liquidity 3. Efficiency 4. Gearing ratios Analysis Profitability Ratios Profitability ratios can be used to measure how good the company is using its assets and how well the company is controlling its costs to generate an acceptable rate of return (Gitman and McDaniel, 2008). The various profitability ratios are given below Gross Margin Gross margin can be defined as the ratio of gross profit to total sales. The graph below shows the trend of the same: As can be seen from the graph, the gross margin of Tesco is more than that of Morrison’s in the year of 2009. However, while the gross margin has increased for Morrison’s from 2009 to 2010 while the same has decreased for Tesco. One point to note here is the sales done by both the companies. While Tesco had sales of the order of ? 56,910m in 2010, Morrison’s had just ? 15,410m. This difference is an indication of the size of the two companies. It is evident that in terms of sales, Tesco is well ahead of Morrison’s. Profit Margin Profit margin of a company can be defined as: The graph below shows the trend for profit margin for both the companies: Here again, the margin is more for Tesco as compared to that of Morrison’s in 2009. While the profit margin has increased considerably from 2009 to 2010, the same has remained almost equal for Tesco. The higher profit margin of Tesco indicates that the company is having a better control over its costs as compared to Morrison’s (Investopedia). Just like the gross sales, the value of net profit of Tesco (? 2,336m) is almost four times that of Morrison’s (? 598m). Return on assets and investments While return on assets measure the amount of net income generated for each unit of assets, return on investment measures the amount of income generated from each unit of owners’ equity. Return on assets is an ideal tool for comparing companies within the same industry. RoA is an indication of both the profit margin as well as asset turnover (Needles et al., 2010). The graph on the side here shows the Return on Assets for both the organization. The RoA is almost equal for both the companies. This indicates that both the organizations have almost equal efficiency in utilizing their assets. The graph on the side here shows the Return on Investment for both the organizations. RoI is more for Tesco in 2009 which indicates better return on investor wealth. One issue being faced by Tesco is a reduction in the RoI from 2009 to 2010. This imply that the average profit generated from the amount of income generated from owner’s equity has declined for Tesco from 2009 to 2010. Liquidity Ratios Liquidity ratios are the set of ratios that can be used to determine if the company will be able to pay its short-term debts (Brigham and Houston, 2008). Higher the value of these ratios, the larger the company has the ability to pay off its short term debts and hence it is more safe. Current Ratio Current ratio is a ratio that is an indication if a firm is having enough resources to pay off its debt coming over in the following 12months. The ratio can be calculated as: The graph on the side shows the current ratio for both the companies for 2009 and 2010. While the ratio has increased marginally for Morrison’s, the same has decreased for Tesco. Moreover, it can be seen from the graph, value of current ratio for both the companies is less than 1. This implies that both the companies do not have the sufficient current assets to pay their current liabilities. This is realistic of retail industry. The ratio has decreased for Tesco from 2009 to 2010. This is primarily attributable to decrease in current assets for the organization. Acid-test ratio Acid-test ratio is a stricter ratio as compared to the current ratio used to measure the liquidity of a firm. It is based on the premise that inventory as a current asset is not useful in short term because of the possibility of it being slow-moving or obsolete or pledged to some creditors (Gibson, 2008). The formula for acid-test ratio which is also known as quick ratio is given below: The graph on the page below shows the acid-test ratio for both the companies. The ratio is less than one for both the companies which is not an advisable position. It can also be seen that, there is significant difference between the current ratio and the acid-test ratio for both the companies which implies that these companies are dependent on inventory for meeting their current assets requirement. Activity Ratios These ratios which are also called the efficiency ratios are an indication of the efficiency with which the company is using its short-term resources. These ratios are used to measure the length of various segments of an operating cycle of a company (Nikolai et. Al., 2009). Asset turnover ratio Asset turnover ratio is an indication of the relationship between total revenues and total assets. It can be calculated as: The ratio is an indication of the amount of dollar sales generated for each dollar of assets. Generally, companies having a low profit margin tend to have high asset turnover. The graph on the side here shows the asset turnover for both the companies. As can be seen from graph, the asset turnover for Tesco is more than that of Morrison’s for both the years. This indicates that Tesco is more efficient in generating sales from its assets (Porter and Norton, 2010). The asset turnover for both the companies is more than 1. Inventory turnover ratio The inventory turnover ratio is an indication of the speed of conversion of inventory into sales. Inventory turnover ratio can be calculated as: This ratio is an indication of the number of times a company’s inventory is sold and replaced over a period of time. The graph above shows the inventory turnover ratio for Tesco and Morrison’s. The ratio has decreased for Tesco while the same has increased by a small margin for Morrison’s. A low inventory turnover for Morrison’s might indicate poor sales resulting in excess inventory. The higher inventory turnover of Tesco indicates that the company can sustain its current sales volumes (Webster, 2003). Gearing ratios Gearing ratios are the set of ratios that are used to measure the ratio between various types of equities and debt. It is an indication of the financial leverage and exhibits the degree to which a firm’s activities are funded by owner’s funds versus debt (The Free Dictionary, 2011). Debt to equity ratio This ratio is an indication of the financial leverage of a company. It is a representation of the proportion of contribution of the equity and debt in financing the assets for the company. It can be calculated: The graph below shows the debt to equity ratio for Tesco and Morrison’s: As can be seen from the graph, the ratio is higher for Tesco in both the years. This indicates that Tesco has financed its assets by more debt as compared to that of Morrison’s. The trend shows that the ratio has decreased for Tesco from 2009 to 2010 while the same has increased for Morrison’s. Higher debt being used to finance the assets indicates higher interest expense. Generally, higher leverage is not advisable because of the high risks in cases of downturns in business cycles which may lead to inability of a company to service its debt owing to poor sales (Investorwords, 2011). Equity Ratio Equity ratio is an indication of the amount of assets financed by equity. It can be defined as: The graph below shows the equity ratio for both the companies over 2009 and 2010: As can be seen from the graph, Morrison’s is having lesser proportion of its assets being financed by equity as compared to Morrison’s. The ratio has increased over from 2009 to 2010 for both the companies. This can be explained by the global slowdown which resulted in high rates of funds from borrowing. Market Ratios Market ratios are an indication of the prices of the stocks as perceived by an investor. These ratios give an indication of the amount of money generated from owning company’s stocks and the cost of owning the same Earnings per share One of the most important ratio that is often considered as the single most determining factor of share price is Earning per Share. Earnings per share (EPS) can be calculates as: The graph below shows the EPS for both the companies in 2009 and 2010: As can be seen from the graph, the EPS is more for Tesco as compared to Morrison’s. The same has increased from 2009 to 2010 for both the firms. EPS is generally considered as the most important ratio to be calculated while evaluating the profitability of a firm and its stocks. Performance Factors One of the major factors that would have affected the performance of these companies is the global financial slowdown. With the unemployment rates rising in 2009 and wages going down, people had less money to spend. This had an adverse effect on the supermarket chains in the way of consumers looking for cheaper products. Conclusion The analysis for various ratios has shown certain interesting trends. While it is evident that Tesco is almost four time the size of Morrison’s. Although the probability of Tesco is more than that of Morrison’s, the same has decreased from 2009 to 2010. Both the companies have shown an increasing trend of Return on investment and return on asset over the two period of time. This can be attributed to the coming out of the global economy from financial crisis. The liquidity ratios for both the organizations are less than 1 which indicates that the firms will not be able to pay off their current liabilities from their current assets. Tesco is generating more dollar sales for each unit of assets held as compared to Morrison’s which indicates operational efficiency. In addition, the number of times that the inventory is turned into cash is more for Tesco as compared to Morrison’s. The capital structure of both the organizations indicates that Tesco is heavily financed by debt. This indicates that the interest outflow of Tesco is more than that of Morrison’s. When comparing for the returns to investor, the Earnings per share is more for Tesco than that of Morrison’s. To conclude, it is evident that Tesco has outperformed Morrison’s in all the aspects. Bibliography Brigham, E.F., and Houston, J.F., 2008. Fundamentals of financial management. 6th ed. Cengage Learning. The Free Dictionary, 2011. Gearing Ratio. [online]. Available at: < http://financial-dictionary.thefreedictionary.com/Gearing+Ratio> [Accessed on 03 April 2011]. Gibson, C.H., 2008. Financial Reporting & Analysis using Financial Accounting Information. 11th ed. OH: South-Western Cengage Learning. Gitman, L.J., and McDaniel, C., 2008. The Future of Business: The Essentials. 4th ed. OH: South-Western Cengage Learning. Investopedia, 2011. Profit Margin. [online] Available at: [Accessed 03 April 2011]. Investorwords, 2011. Debt/equity ratio. [online]. Available at: < http://www.investorwords.com/1316/debt_equity_ratio.html> [Accessed 03 April 2011]. Khan, M.Y., and Jain, P.K., 2006. Management Accounting: Text, Problems and Cases. 4th ed. New Delhi: Tata McGraw-Hill. Needles, B.E., Powers, M., and Crosson, S.V., 2010. Principles of Accounting. 11th ed. OH: South-Western Cengage Learning. Nikolai, L.A., Bazley, J.D., and Jones, J.P., 2009. Intermediate Accounting. 11th ed. OH: Sout-Western Cengage Learning. Porter, G.A., and Norton, C.L., 2010. Financial Accounting: The Impact on Decision Makers. 7th ed. OH: South-Western Cengage Learning. Siegel, J.G., and Shim, J.K., 2006. Accounting Handbook: Barron’s Accounting Handbook. 4th ed. New York: Barron’s Educational Services. Stoltz, A., Viljoen, M., Gool, S., Cronje, R. and Meyer, C. 2007. Financial Management : fresh perspectives. South Africa: Pearson Prentice Hall. Tesco, 2010. Tesco Plc Annual Report and Financial Statements 2010, Cheshunt: Tesco PLC. Websters, W.H., 2003. Accounting for Managers Briefcase book. US: Mc-Graw Hill Professional. Wm Morrison Supermarkets PLC, 2010. Annual reports and financial statements 2010, Bradford: Wm Morrison Supermarkets PLC. Read More
Cite this document
  • APA
  • MLA
  • CHICAGO
(“Financial analysis of Morrisons and comparison with Tesco Coursework”, n.d.)
Retrieved from https://studentshare.org/finance-accounting/1414264-financial-analysis-of-morrisons-and-comparison-with-tesco
(Financial Analysis of Morrisons and Comparison With Tesco Coursework)
https://studentshare.org/finance-accounting/1414264-financial-analysis-of-morrisons-and-comparison-with-tesco.
“Financial Analysis of Morrisons and Comparison With Tesco Coursework”, n.d. https://studentshare.org/finance-accounting/1414264-financial-analysis-of-morrisons-and-comparison-with-tesco.
  • Cited: 1 times

CHECK THESE SAMPLES OF Financial analysis of Morrisons and comparison with Tesco

Dynamics of Strategy

Contents Contents Contents 2 Contents 2 ABSTRACT 3 INTRODUCTION 4 EXTERNAL ANALYSIS 5 NINE ANALYTICAL STRATEGIC TOOLS 5 PESTEL ANALYSIS 6 PORTER'S FIVE FORCES ANALYSIS 9 DEGREE OF TURBULENCE 11 GROWTH AND LIFE CYCLE ANALYSIS 12 INTERNAL ANALYSIS 12 ONLINE RETAILING FINANCIAL ANALYSIS 13 FOUR LINK ANALYSIS 17 CUSTOMER ANALYSIS 18 VALUE CHAIN ANALYSIS 19 ANSOFF MATRIX 21 PORTER'S DIAMOND MODEL 22 BALANCED SCORECARD 23 RISK ANALYSIS 24 STRATEGIC FIT ANALYSIS 26 FUTURE TREND 28 CONCLUSION 28 BIBLIOGRAPHY 29 APPENDICES 32 ABSTRACT The current study aims to reflect upon a detailed analysis of the strategic trends and working busine… ss practices of the UK food retailing industry....
23 Pages (5750 words) Dissertation

Understanding and interpreting financial statements

Based on the above discussion, tesco performed financially better than Morrison's.... There are more financial statement ratios indicating tesco did better than Morrison's.... However, some financial statement ratios indicate Morrison's performed financially better than tesco.... … The study focuses on the performance of Morrison's and tesco companies for 2008 and 2009.... The study focuses on the performance of Morrison's and tesco companies for 2008 and 2009....
7 Pages (1750 words) Coursework

The Return on Equity

As an ordinary the areas of greatest concern when considering an investment in companies such as Morrison and tesco would be to judge their current market share, the projected rate of a return on investment as well as the effective allocation of capital to ensure the lowest running possible without jeopardising brand position or long-term debt increases.... As the UK supermarket sector standings show it is tesco who have had the advantage over its competitors for the last decade (30....
11 Pages (2750 words) Assignment

Wm Morrison Supermarkets Plc

The branded name of the company is morrisons, and it is part of the FTSE 100 Index of companies.... morrisons has now a remarkable stronghold in the supermarket chain and has earned good profits through the years and has given good divident to its shareholderes.... Here, in this essay the Technological, financial and marketing techniques implemented by morrisons for its success is being discussed.... The market share of the morrisons gained and it extended beyond its rivals....
12 Pages (3000 words) Case Study

Morrisons PLC Purchase Analysis

The following report will demonstrate… hat this purchase may have constituted a bad decision on the part of morrisons Financial Management, since it has impacted adversely upon shareholder earnings.... Morrisons purchased the Safeway chain of stores in 2004, after competition regulators blocked the other three supermarket chains – tesco, Sainsbury and Asda from integrating Safeway, which was in the fourth position then (Flanagan, 2005).... morrisons has recently experienced losses as it has struggled to integrate the Safeway chain of stores into its own retail base, which has caused its annual profits to drop substantially....
10 Pages (2500 words) Essay

TESCO PLC AND THE NATURE OF MARKETS IN WHICH IT OPERATES

Being the third biggest and fastest growing grocery and general merchandising retailer in the United Kingdom, tesco Plc is selling a wide-range of grocery products and wine; entertainment products such as books, CDs, DVDs; PC, photo and gaming items; landline and mobile phones;… ome electrical appliances; ready-made and made-to-order furniture items; car and garden supplies; sports and leisure products; and a wide-range of toys and clothing for babies and toddlers throughout its store outlets in 14 countries around Asia, Europe, and North America (tesco As one of the biggest players within the UK retail grocery industry, tesco's market share was 30....
14 Pages (3500 words) Essay

Giving economic circumstances over the last five years of how Tesco, Sainsbury and Morrisons have coped

This study will make an analysis of performance of the three retail giants in UK during recession period using comparative analysis of its financial performance as an indicator.... Government policies to stimulate economy will also be inspected tesco is one of the world's largest retailers with operations in 14 countries, employing over 500,000 and serving tens of millions of customers every week.... Diversified businesses: retailing of books, clothing, electronics, furniture, petrol and software, financial services, telecoms and internet services, DVD rentals and downloads....
4 Pages (1000 words) Essay

Tesco and Morrison Companies

omparing the Financial Statement analysis of both the companies Morrison and Tesco, it is found that the total asset of Morrison for the financial year 2014 and 2013 is 10729 and 10527 billion pounds respectively.... This report "tesco and Morrison Companies" discusses and analyzes the two companies Morrison and tesco and a brief comparison between them highlighting its nature, strength and weaknesses is prepared.... nbsp;… Both Morrison and tesco are from the same retail industry....
8 Pages (2000 words) Report
sponsored ads
We use cookies to create the best experience for you. Keep on browsing if you are OK with that, or find out how to manage cookies.
Contact Us