StudentShare
Contact Us
Sign In / Sign Up for FREE
Search
Go to advanced search...
Free

Intercontinental Hotels Group Plc Finance Performance - Assignment Example

Cite this document
Summary
The paper "Intercontinental Hotels Group Plc Finance Performance" indicates that the company has successfully increased its revenue by $67 million compared to the previous year’s sales. This may be due to effective advertisement or increased investment in noncurrent assets…
Download full paper File format: .doc, available for editing
GRAB THE BEST PAPER98.7% of users find it useful
Intercontinental Hotels Group Plc Finance Performance
Read Text Preview

Extract of sample "Intercontinental Hotels Group Plc Finance Performance"

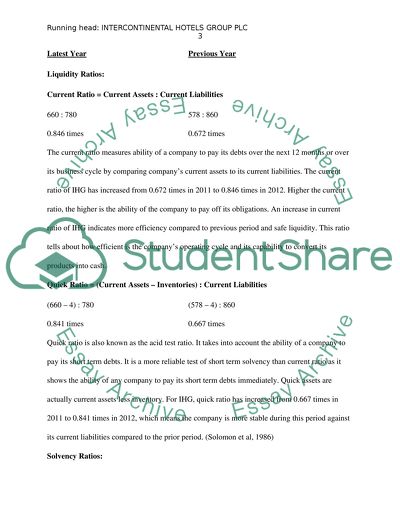
Financial Analysis Comparison of latest year results with previous year results: The sales of Intercontinental Hotels Group (IHG) PLC have increased from $1768 million to $1835 million. This indicates that the company has successfully increased its revenue by $67 million compared to previous year’s sales. This may be due to effective advertisement or increased investment in noncurrent assets. However, the company’s cost of sales in the current year has increased with the increase in turnover. Although, the increase in cost of sales is $1 million, this may be due to several reasons, including increased raw material prices and decreased discounts received compared to the previous year. Increase in cost of sales has made no large effect on the gross profit in 2013 because the turnover has increased with a greater proportion than the cost of sales. The revenue in 2013 has increased by 3.79% while the increase in cost of sales is just as low as 0.13%. This has caused the gross profit of the company to increase by 6.62% in 2013. Other operating income of $57 million in 2012 has disappeared in 2013 causing an expense of $3 million in 2013, and the administrative expenses have decreased from $381 million in 2012 to $379 million in 2013. This has contributed towards the favourable effect on the operating profit in 2013. The finance cost of the company has decreased from $64 million in 2012 to $57 million in 2013. This is due to the decreased proportion of noncurrent liability causing a decrease in the interest liability of the company. However, the finance income has increased from $2 million in 2012 to $3 million in 2013. This is probably due to the increase in long term investments in noncurrent assets. (Kline, 2007) Ratio Analysis: Latest Year Previous Year Liquidity Ratios: Current Ratio = Current Assets : Current Liabilities 660 : 780 578 : 860 0.846 times 0.672 times The current ratio measures ability of a company to pay its debts over the next 12 months or over its business cycle by comparing company’s current assets to its current liabilities. The current ratio of IHG has increased from 0.672 times in 2011 to 0.846 times in 2012. Higher the current ratio, the higher is the ability of the company to pay off its obligations. An increase in current ratio of IHG indicates more efficiency compared to previous period and safe liquidity. This ratio tells about how efficient is the company’s operating cycle and its capability to convert its products into cash. Quick Ratio = (Current Assets – Inventories) : Current Liabilities (660 – 4) : 780 (578 – 4) : 860 0.841 times 0.667 times Quick ratio is also known as the acid test ratio. It takes into account the ability of a company to pay its short term debts. It is a more reliable test of short term solvency than current ratio as it shows the ability of any company to pay its short term debts immediately. Quick assets are actually current assets less inventory. For IHG, quick ratio has increased from 0.667 times in 2011 to 0.841 times in 2012, which means the company is more stable during this period against its current liabilities compared to the prior period. (Solomon et al, 1986) Solvency Ratios: Debt to Equity Ratio = Total Debt : Total Equity 2946 : 317 2413 : 555 9.293 times 4.348 times This ratio is also a measure of the ability of a company to repay its obligations. If this ratio is increasing then it means that company is being financed by creditors, which may be a dangerous trend and the company might need to finance its assets more through equity by issuing new shares. IHG’s debt to equity ratio was 4.348 times in 2011 and it has increased to 9.239 times in 2012, which is not a good indication. Lenders and creditors’ interests are worse protected when this ratio is high. Thus, companies with high debt to equity ratio like IHG might be unattractive for lenders and creditors. (Gibson, 2006) Debt to Assets Ratio = Total Debt : Total Assets 2946 : 3263 2413 : 2968 0.903 times 0.813 times The debt to assets ratio for IHG was 0.813 times in 2011 which has increased to 0.903 times in 2012. This ratio determines the amount of the debt element in relevance to the total assets. It tells how much the company is dependent on its own assets and how much on the debt taken from lenders. It is a financial ratio, which indicates the proportion of an entity’s assets and debt used to finance the operations. (Ingram, 1994) Working Capital Management Ratios: Receivables Days = (Receivables/Sales) x 365 (422/1835) x 365 (369/1768) x 365 83.94 days 76.18 days Payables Days = (Payables/Cost of Sales) x 365 (709/772) x365 (707/771) x 365 335.2 days 334.7 days Working capital management ratios measure how well a company is utilizing its working capital cycle. IHG’s receivables days have increased from 76 days to 84 days approximately. This could indicate that management of IHG is investing in too many accounts receivables assets to support its sales, which could result as excessive amounts of bad debts. It also indicates that the group has been inefficient to collect its payments from receivable in time and the receivables are taking longer time to pay back to the group. The payables days have remained almost equal to those of the previous year. So the group has to take steps to make its customers pay on time, so that the cycle runs effectively. (Sagner and James, 2010) Profitability Ratios: Gross Profit Margin = Gross Profit : Revenue 1063 : 1835 997 : 1768 57.929% 56.391% The gross profit ratio is the key financial indicator to assess company’s profitability from its core activities. It reveals the financial health of a firm. IHG’s gross profit ratio has increased to 57.929% in 2012 from 56.391% in the year 2011. This is because the profit has also increased in proportion to turnover the company. (Mongiello, 2009) Return on Capital Employed = Operating Profit : Capital Employed 610 : 2386 594 : 2728 25.566% 21.774% It is the return that a company achieves from its capital employed. Capital employed is a sum of equity and non-current liabilities. IHG’s return on capital employed was 21.774% in 2011 and it increased to 25.566% in 2012. This indicated that IHG’s capital investments were more efficient and more profitable. Return on capital employed should always be higher than the company’s borrowing rate, otherwise any increase in borrowing will reduce shareholders’ earnings. Asset Efficiency Ratios: Account Payables Turnover = Cost of Sales : Avg. Account Payables 772 : 709 771 : 707 1.090 times 1.091 times The account payables turnover has remained almost the same as the previous year. This ratio tells that for every $1of account payables, there is almost $1.09 invested in /cost of sales. (Baker and Powell, 2005) Total Assets Turnover = Revenue : Avg. Total Assets 1835 : 3263 1768 : 2968 0.562 times 0.596 times Total assets turnover has decreased from 0.596 times in year 2011 to 0.562 times in 2012. This indicates that for every $1 of total assets, the revenue generated is $0.562 which was $0.596 in the previous period. (Fabozzi et al, 2003) The IHG has performed much better in this year compared to the previous year, measured against the key performance indicators it has set. The net rooms supply has increased from 658,348 rooms to 675,982 rooms in the latest year. The percentage increase in the net rooms supply is 2.68%. The growth in fee revenue has also increased from 5.7% in the previous year to 6.8% in the current year. Fee based margins have increased from 40.6% to 42.6% in the latest year. However, the Global RevPAR growth of 6.2% in the previous year has declined to 5.2%. Employee engagement scores have increased from 75.8% in the previous year to 78.6% in the current year. Total gross revenues have also increased from $20.2 billion in the previous year to $21.2 billion in the latest period. System contribution to revenue has also increased from 68% in the previous year to 69% in the current year. Hotels signed up for Green Engage have increased in number as compared to the previous year. They were 1772 hotels in the previous year, increased to 2219 in the current year. The participants benefitting from the IHG Academy have increased from 5608 in the previous year to 6377 in the current year. The key performance indicators that the company has set are very useful for determining its performance and betterment seen in the current period as compared to the previous periods. The group is exploring new markets that are most attractive from its business perspective and increase the revenue. The number of new hotels that have opened are 4602 in the latest year. This has resulted in an increased number of rooms available for supply, the percentage growth in free revenue and the percentage increase in fee based margins. The group has launched two new brands in two new geographies, which justifies its brand preferences. It also encourages its employees, and is the key performance indicator of the group’s of employee engagement scores. Total gross revenue increased by $1 billion, which is the key performance indicator of the group’s best-in-class delivery. The increase in1% of system contribution to revenue also justifies the key performance indicator of the group’s best-in-class delivery. The group also behaves as a responsible business because it has signed up more of its hotels for Green Engage, which shows its responsibility towards the environment. Moreover, the participants benefitting from the International Hotels Group Academy have also increased by 769 in number which is also the key performance indicator of the group’s responsibility. (Chen, 2008) Ratio analysis is easy to understand and simple to calculate. While key performance indicators are helpful to monitor the performance of a company. But the biggest disadvantage of ratio analysis is that it does not provide useful information until it is compared to any relevant period’s data. The benchmark is necessary to be provided to make the analysis useful. However, the ratios if properly examined can cater the potential investors in the decision making process. The key performance indicators have the biggest drawback that they are set by the company itself to benchmark its performance. It is a type of internal benchmarking which is not effective. Industrial benchmarking is a better way to evaluate the performance of any company. (Brigham and Houston, 2004) References: BAKER, H. K., & POWELL, G. E. (2005). Understanding financial management: a practical guide. Malden, MA, Blackwell Pub. BRIGHAM, E. F., & HOUSTON, J. F. (2004). Fundamentals of financial management. Mason, Ohio, Thomson/South-Western. CHEN, J. S. (2008). Advances in hospitality and leisure. Vol. 4 Vol. 4. Bingley, U.K., Emerald. http://www.emeraldinsight.com/1745-3542/4. FABOZZI, F. J., PETERSON DRAKE, P., HABEGGER, W. D., & PETERSON DRAKE, P. (2003). Financial management and analysis. Hoboken, Wiley. GIBSON, C. H. (2006). Financial reporting and analysis. Mason, Ohio, South-Western. INGRAM, R. W. (1994). Financial accounting: information for decisions. Cincinnati, Ohio, College Division, South-Western Pub. Co. KLINE, B. (2007). How to read and understand financial statements when you dont know what you are looking at. Ocala, Fla, Atlantic Pub. MONGIELLO, M. (2009). International Financial Reporting. [Frederiksberg], Forlaget Ventus. SAGNER, JAMES. (2010). Essentials of Working Capital Management. John Wiley & Sons. http://www.myilibrary.com?id=282264. SOLOMON, L. M., VARGO, R. J., & WALTHER, L. M. (1986). Accounting principles. New York, Harper & Row. Read More
Cite this document
  • APA
  • MLA
  • CHICAGO
(“Intercontinental Hotels Group plc Finance report Assignment”, n.d.)
Intercontinental Hotels Group plc Finance report Assignment. Retrieved from https://studentshare.org/finance-accounting/1630017-intercontinental-hotels-group-plc-finance-report
(Intercontinental Hotels Group Plc Finance Report Assignment)
Intercontinental Hotels Group Plc Finance Report Assignment. https://studentshare.org/finance-accounting/1630017-intercontinental-hotels-group-plc-finance-report.
“Intercontinental Hotels Group Plc Finance Report Assignment”, n.d. https://studentshare.org/finance-accounting/1630017-intercontinental-hotels-group-plc-finance-report.
  • Cited: 0 times

CHECK THESE SAMPLES OF Intercontinental Hotels Group Plc Finance Performance

Employees Job Satisfaction in an Intercontinental Hotel Group

ounded back in 2004, intercontinental hotels group (IHG) PLC is considered one of the leading hotel companies around the world.... The paper "Employees Job Satisfaction in an Intercontinental Hotel group" determines the extent wherein CSR initiatives can affect Intercontinental Hotel group employees' job satisfaction.... (3) Carefully listen to employees' ideas and other concerns, demonstrate to them the main objectives of the company's CSR strategies, and encourage the CEO to be friendly and easily approached by the rest of the employees to win the trust and support of a diverse group of employees....
40 Pages (10000 words) Dissertation

Intercontinental Hotels Group: Financial Analysis

This essay "intercontinental hotels group: Financial Analysis" presents a comprehensive analysis of the financial performance and position of the intercontinental hotels group as per the financial information available for the last two financial years (i.... The payments made to these owners are recognized as capital expenditures and following a straight-line method, they are amortized over a period of ten years (intercontinental hotels group, 2011)....
8 Pages (2000 words) Essay

Intercontinental Hotels Group Plc

This coursework "intercontinental hotels group plc " discusses the Annual Report of the Intercontinental Hotel Group for the year ended 31 December 2011 that has been analyzed to ascertain the financial performance and position of the company.... Financial performance and position of the Group 'The big picture is 9 hotel brands, over 153 million guests annually, more than 672,000 rooms in over 4,500 hotels in nearly 100 countries and territories around the world' (IHG website, 2012), The nine renowned brands being intercontinental hotels & Resorts, Crowne Plaza Hotels & Resorts, Hotel Indigo, Holiday Inn Hotels & Resorts, Holiday Inn Express, Staybridge Suites, Candlewood Suites, EVEN Hotels, Hualuxe Hotels, and Resorts....
7 Pages (1750 words) Coursework

Disaster related risk management practices in IHG

With respect to risk management, the key objective of the organization is to recognize and manage risks, in line with the strategic objectives and long-term value of the business (intercontinental hotels group plc, “Corporate Risk Management”).... With these considerations, the essay discusses disaster risk management practices in an organization namely intercontinental hotels group (IHG) in Japan.... Franchising is the biggest part of the business of IHG, however, it also uses the bricks and mortar model of business (intercontinental hotels group, “Overview”)....
4 Pages (1000 words) Essay

Financial Performance of Intercontinental Hotels Group Plc

Some of the prominent brands held by the group include: intercontinental hotels and Resorts, Crowne Plaza Hotels and Resorts, Hotel.... ... ... In terms of number of rooms, the company is the largest in the world. ... ... ross margin can be defined as the ratio of gross profit to total sales....
8 Pages (2000 words) Essay

Intercontinental Hotels Group

This report "intercontinental hotels group" focuses on a multinational hotel company that is headquartered in the region of the United Kingdom.... The group owns nine very popular hotel brands like InterContinental, Crowne Plaza, Hotel Indigo, Staybridge Suites, Holiday Inn, Holiday Inn Express, Candlewood Suites, Hualuxe Hotels and Resorts as well as Even HotelsWhile performing a strategic performance analysis for the InterContinental Hotel Group from the investors' point of view, it is important to focus on conducting an overview of the global hospitality industry along with estimating the growth of the company in recent times....
6 Pages (1500 words) Report

Finance, Funding and Legislative Frameworks for Success

intercontinental hotels group plc is the largest British multinational hotel.... intercontinental hotels group plc is the largest British multinational hotel.... Introduction intercontinental hotels group plc is a British multinational hotel which is headquartered in Denham, UK.... intercontinental hotels group uses its balanced scorecard to deliver high–quality growth and long-term value to all its stakeholders.... intercontinental hotels operate under nine hotel brands that have a deep history and heritage....
10 Pages (2500 words)

Comparison between Facebook and Alibabas Performance

The paper "Comparison between Facebook and Alibaba's performance" is a perfect example of a report on finance and accounting.... The paper "Comparison between Facebook and Alibaba's performance" is a perfect example of a report on finance and accounting.... Both of these methods have particular advantage and disadvantage....
24 Pages (6000 words)
sponsored ads
We use cookies to create the best experience for you. Keep on browsing if you are OK with that, or find out how to manage cookies.
Contact Us