StudentShare
Contact Us
Sign In / Sign Up for FREE
Search
Go to advanced search...
Free

The impact of EU membership on Finland - Research Paper Example

Cite this document
Summary
The following paper "The impact of EU membership on Finland" explores the impact of EU membership on Finland. Admittedly, in a single EU market area, customs duties do not exist thus the sale of the exports by one of the EU members goes another member. …
Download full paper File format: .doc, available for editing
GRAB THE BEST PAPER96.9% of users find it useful
The impact of EU membership on Finland
Read Text Preview

Extract of sample "The impact of EU membership on Finland"

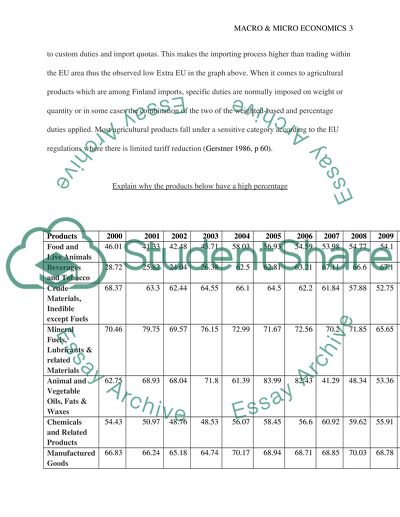
The impact of EU membership on Finland Why Extra EU (Trading Outside Europe) is not high? From the graph above, the intra-EU recorded the highest figures of about 39, 000 Million Euros compared to the Extra-EU whose highest figures were at 37500 million euros. In most of the years between 2000 and 2011, the Intra-EU was higher compared to Extra-EU apart from the period between 2006 and 2008. In the graph above, the graph shows that the Extra EU is low in Finland. This situation follows the fact that in a single EU market area, custom duties do not exist thus the sale of the exports by one of the EU members goes another member. Importing any products from a county that is not a member of the EU means that the products will be subjected to custom duties and import quotas. This makes the importing process higher than trading within the EU area thus the observed low Extra EU in the graph above. When it comes to agricultural products which are among Finland imports, specific duties are normally imposed on weight or quantity or in some cases the combination of the two of the weighted-based and percentage duties applied. Most agricultural products fall under a sensitive category according to the EU regulations where there is limited tariff reduction (Gerstner 1986, p 60). Explain why the products below have a high percentage Products 2000 2001 2002 2003 2004 2005 2006 2007 2008 2009 2010 2011 Food and Live Animals 46.01 41.33 42.48 45.71 58.03 56.93 54.59 53.98 54.77 54.1 51.77 51.84 Beverages and Tobacco 28.72 25.82 24.04 26.38 62.5 62.81 63.21 67.11 66.6 67.1 67.01 61.84 Crude Materials, Inedible except Fuels 68.37 63.3 62.44 64.55 66.1 64.5 62.2 61.84 57.88 52.75 52.87 48.95 Mineral Fuels, Lubricants & related Materials 70.46 79.75 69.57 76.15 72.99 71.67 72.56 70.2 71.85 65.65 74.89 75.53 Animal and Vegetable Oils, Fats & Waxes 62.75 68.93 68.04 71.8 61.39 83.99 82.43 41.29 48.34 53.36 74.45 77.21 Chemicals and Related Products 54.43 50.97 48.76 48.53 56.07 58.45 56.6 60.92 59.62 55.91 54.35 54.37 Manufactured Goods Classified by Materials 66.83 66.24 65.18 64.74 70.17 68.94 68.71 68.85 70.03 68.78 65.65 65.13 Machinery and Transport Equipment 45.91 43.02 45.07 41.44 43.66 44.74 45.41 45.43 44.22 46.27 39.66 42.59 Miscellaneous Manufactured Articles 48.58 47.28 46.5 47.82 59.45 58.38 57.08 56.42 53.78 54.38 52.23 51.05 Other Commodities & Transactions 99.38 96.04 97.21 95.99 67.95 66.35 64.49 60.77 59.61 52.07 53.73 54.49 In the table above, it is clear that the main Exports as per the latest statistics in 2011 coming from Finland include; Mineral fuels, lubricants and related materials (75.53 %), animal and vegetable oils, waxes and fats (77.21% ) and manufactured goods classified by their materials used to make them (65.13 %). This trend follows the government’s initiatives to set aside more money and resources in the above sectors in general. Considering the case of vegetable and animal oils, fats and waxes, the increased exports can also be attributed to the effort by the farmers to employ modern practices when it comes to production such as agricultural machinery, modern inputs, improved seed and animal variety, and the use of chemical insecticides and fertilizers. The Chemical industry in Finland which has emerged as its largest industry sector has facilitated the large exports witnessed in lubricants, mineral fuels and manufactured goods as the industry produces a wide range of products that are used by other industrial sector such as agriculture, oil products, paints, petrochemicals, plastics and environmental products. Finland’s manufacturing industry has been remarkable in the recent producing some of the best products in the market hence the large exports witnessed in the manufactured goods. Some of the notable manufactured goods include mobile phones by Nokia, paper products by Stora Enso, oil products by Neste Oil and cruise ships by Aker Finnnyards. Its exports have also been facilitated by its sophisticated financial market compared to most of the EU countries such as the UK (O’Sullivan, Sheffrin and Prerez 2009, p 41). Why is Intra EU inflows Higher than Extra Eu Inflows The graph indicates that the Intra EU inflows in Finland are higher than the Extra EU inflows from the year 2000 to 2011 with the exemption of 2008. This follows the fact that, in Finland, inward FDI flows with regards to services have been dominated by financial intermediation and business services. The services weight in the intra EU stocks is higher compared to the extra EU. This is as a result of more investment in the services activities. This leads to an increase in the share of manufacturing at the same period of time thus an increase in the stocks invested in other activities. The higher inflows can also be explained by an increase in the important activities related to the manufacturing sector in FDI terms such as chemical, rubber, plastic products and petroleum which attracted more investors. A higher Intra EU inflow implies that Finland has a higher foreign direct investment following the regulation levels within the EU being lowered as well as then FDI restrictions and market-product regulation being lowered following Finland membership in the EU. This situation normally results in a convergence process where investors tend to flow into a nation or a region where such regulations have been lowered and this is what happened in Finland. Why they Finland do FDI with EU 10 members The gravity mode theory is used in estimating the international trade pattern. The theory focuses more on the spatial and geographical factors that impact the comparative advantage. This theory implies that nations whose incomes are of similar levels tend to be attracted to trade together in differentiated goods and services following their similarities. The theory predicts that the patterns of trade are normally based on relative abundance factor. With reference to the gravity model theory that puts into consideration regional integration, for a nation to be a member of the EU, it has to have a positive and significant impact on the flows of FDI into the EU as well as into the UK coming from the both the outside states and EU member states. The main reason behind these flows is the reduced barriers by the interested countries to access a larger market (Tutkimuslaitos 2008, p 8). The increase in FDI flows has been associated with a number of direct benefits with regards to increased capital stock as well as other dynamic benefits. A good example is the UK which is well positioned to attract FDI from regional integration following its flexible market, openness and agglomeration economies (Forfattare, 2008, p. 7). Monetary Policy Finland being a member of the EU, the EU system takes it as part of its responsibility to be involved in the implementation of its monetary policy. This implies that the monetary policy has to take into consideration the operations of the national central banks as well as the European Central Bank. As member of the EU, the Bank of Finland is involved in the preparation of one monetary policy as well as decision making related to monetary policy and its implementation. The main objective of the monetary policy is the maintenance of price stability thus safeguarding the purchasing power (Baldwin and Portes 1997, p 130). One of the main monetary instruments is the interest rates. The interest’s rates key levels greatly impact the macroeconomic development and market prices. Such rates are normally set by the governing council of the banks in Finland. The monetary policy in Finland is seen as to have been based on the best interests of the nation as it consolidates the public finance ensuring that the government operations and debts remain in control. It is this consolidation that has ensured that Finland has maintained an external trading position that is comfortable. The aim of the policy is to target the inflation rates of the country as the nation was in need of a new credibility and nominal anchor following the abandonment of the fixed exchange rate. After the exchange rate stability loss, it was more appropriate for the policy to target inflation. The inflation target has positively impacted the economy of Finland as its transparency on the monetary policy has improved as well as the Bank of Finland transparency. Inflation rates in the country have been lowered substantially. The other consideration of the monetary policy is the fixed rate with regards to the open market. There existed some parallels with the policy of the bank in relation to the fixed rates. As the Bank of Finland was in preference of the variable tender following its provision of more market scope forces and more flexibility, the fixed rate tender was predominant is the past. Such fixed rates have led to the reduction in the uncertainty now that the monetary policy stance played a major role in it. With regards to the volatilities financial market times as a result of globalization and liberalization of its financial sector, the coming up with clear interest rates happens to be a great requirement. What is the impact of montory policy From the graph above, the long term interests rates remain highest compared to inflation and short term interest rates in relation to the monetray policy. From the year 2000 to 2004, all the three are seen to be negativelvly affected by monetary policy as they all decrease. They all assume an increasing trend from 2005 untill 2007 after which they all decline again until when the level off. Monetary policy has been seen to directly affect long term interets rates, short term interest rates and inflation. In the event that monetary policy aggreagates demand to push the capital and labor market in Finland beyond its long-run capacities, prices and wages will tend to increase at high rates. If the monetary policy is in such away that it tries to maintain low short term rates, it is likely to result in inflation as well as high nominal interests rates. In the same case, in long term, such monetary policy will result in tradeoffs leading to reduced long term interest rates. When monetarpolicy manages to contain inflation, then there will be additional premuim to the long term rates What is the role of GDP and Inflation within MonoteryPolicy Looking at the graph above, the rates of inflation in Finland are highest when the GDP is lowest. For example, in the year 2012 when the GDP was lowest, Finland experienced one of the highest inflation rates percentage being placed at around 3.0 percent the same case with 2008 when the GDP was about 0.4 percent corresponding to the highest inflation rate Finland has ever recorded in the last 10 year of about 3.8 percent. However, from the graph, it is evident that the inflation rates in Finland is not directly proportional to its GDP. In some years, the GDP was high yet the inflation rates still happened to be high like in 2000 when the GDP was highest of about 5.0 percent. The same was witnessed in 2009 when the GDP was lowest of about -9.0 yet the inflation rate was not at the highest. The role of the monetary policy is to control inflation and the GDP. This is normally achieved through the Reserve Bank using the monetary policy to maintain the price stability. This ensures that the services and goods do not become too expensive leading to inflation. The monetary policy adjusts the cash rates in that it influences the prices maintaining the price stability. The inflation rates were observed to increase when there was an overall increase in demand for service and goods was more than the capacity of Finland’s economy to sustainably supply services and goods. In such a case, the monetary policy reacts by increasing the cash rates to reduce the increasing inflation rates. When the investors believe that the Reserve Bank has the ability to have the inflation rates as low as possible and maintain such rates in future, this will assist in reducing the actual inflation rates as the effect is self-fulfilling. What role does GDP Growth play in unemployment? The growth in GDP implies that the nation is experiencing an increase in the national output value or national expenditure. With such an increased national output value and expenditure, firms, companies and industries tend to employ more workers thus resulting to more employment in the country. A prolonged period of GDP growth results to a fall in the unemployment. Increased national input and expenditure also results in higher incomes following the economy growth thus reduced rates of retrenching employing and better salaries. Fiscal policy (150) The Finland’s Fiscal policy is aimed at sustainably strengthening the growth potential of its economy, to raise its rates of employment, bolster the spending power of the household as well as improving its international competitiveness and the framework industry condition (Raunio and Tilikainen, 2003, p 49). By doing this, the fiscal policy will manage to support employment and economic growth. This will be achieved through the strengthening of its financing base putting into consideration public finances sustainability as well as substantial reduction in its central government debt to GDP ratio (Raunio and Tilikainen, 2003, p 50). To safeguard the public finances, the policy aims at front-loading revenue and expenditure adjustments to its central government revenue and expenditure. The other aim of the fiscal policy is to relocate expenditure so as to improve the nation’s security and promote growth and employment. The key instruments of the fiscal policy are the annual budget of the states as well as the frameworks for the state budgets in future. The fiscal policy plans have to be reported to other member states of the EU through the Stability Programme (Raunio and Tilikainen, 2003, p 52). Why does government deficit and debt of Finland increase or decrease In the graph above, both the government deficit and government debt are observed to be unstable as they keep on fluctuating although the government deficits are higher compared to the government debts. In some stages, both the deficit and debt were observed to decrease at the same time like from stage 1 to 2 but with different rates. In some cases, the deficit increased while the debt reduced like the situation in stage 8 to 9 or the debt increased as the deficit reduced like in stage 6 to 7. This trend can be associated with fact that during this period, both the public debt and deficit remained below the European Union reference value on the Stability and Growth Pact. The development was greatly affected by the slowdown in tax accruals increase as well as the increase in current transfers that were paid. The reduction of both deficit and debt is strongly associated with the deficit in the local government sector. This followed the increase in local government’s expenditure though its financial position remained weak as a result of a slower growth in received income and tax revenue. The other reason followed the accumulation of the pension funds as well as other social security funds. The fluctuation in the levels of both the deficit and debts was as a result of the changes in the borrowings which changed the state of the gross government debts, the loans received or issues by the nation. What is happening to the government expendtiure, revune and Net lending & borrowing In the graph above, the total government expenditure have steadily increased. The total government revenue also increased steady up to a certain level where it declined but then assumed an upward trend. The total government expenditure and revenue had its figures close to each other with the revenue being slightly higher but after the small decline in revenue, the expenditure figures were higher. The net lending and borrowing by the government were initially high over 20, 000 but rapidly decreased after some time, and the increased steadily to its original level but this dint last as it drastically declined to its lowest levels. Although it recovered, the levels were too low in comparison to its earlier figures. The net lending/borrowing in Finland was observed to be negative. This followed the government measures to attain a GFS balance through having its financial resources to other economy sectors at their disposal as well as nonresidents or in some cases the utilization of other financial resources coming from other sectors. The position of the net lending of Finland is attributed to its net acquisition of the financial assets and liabilities incurrence as well as its purchasing power parity. The above are majorly determined by the total government expenditure and spending. The fiscal policy determines the government spending, its borrowing and revenue raising. The fiscal policy determines the manner in which the government supplies its services and goods such as roads, defense, defense, schools and hospitals as well as benefits and welfare payments. The policy influences the manner in which the government supplies side improvements in its economy like its spending on training and education to improve its labor productivity. It impacts its subsidies on industries, redistribution of income and attaining more equity and its injection of extra spending into its macro economy. Explain the above grapgh, on what is happening with the data? Why is it going up and down? What does government of Finland do with these collection costs? In the above graph, the taxes on household and individual income increased steady from 2000 to 2008 after which it declined up to the year 2010 and then assumed an increasing trend. The taxes on individual income and household income in Finland are generally high in the last ten years with the least being approximately 19, 000 million Euros in 2000 and the highest being witnessed in 2008 when it was around 24, 800 Million Euros. The actual social contributions are relatively high but lower than the individual and household income and the figures have been steady increasing since 2000 apart from 2007 when the figures slightly declined but increased in the following year. VAT has also been increasing over the years apart from 2007 when it’s slightly declined but recovered in the year that followed. The taxes from income or corporations profits have had an unsteady trend over the last ten years. The figures have been increasing and reducing annually. Compared to the situation ten years ago, the contributions have reduced from the initial figure at 8000 Million Euros in 2000 to 5, 000 Million Euros in 2011. The government of Finland directs such income to public services and programs which include dental services, primary and secondary health care, social services, education, sports and culture programs, land use planning, public transportation and promotion of local employment and businesses. Explain the above table, on what sector does the government of Finland spends most of its revenue and why? How does this affect the other secotrs within the table? According to the table above, government spends most of revenue on social protection with the latest figures being placed at 44, 934, Heath, with its figures being 14.829 and General public services at 13, 889.0. Social protection records the highest figures in Finland as social security in Finland is very comprehensive and most advanced compared to other countries. The high numbers witnessed in Health and general public services follow the fiscal and monetary policies of the country that direct large sums of money towards these sectors. This implies that other sectors have to be scrapped off some money to meet the requirements of the three sectors. Explain The above graph why does it increase or decrease?What role does unemployment benefits have on total unemployment rate? The table bellow shows a steady increase in the unemployment benefits which transforms to a reduction in the unemployment rates in the early stages until a certain level when the two increase to some level after which they decrease to a level of about 4000.Unemployment has been observed to benefit its raise durations mainly through income effects that are non-distortionary and not substitution impacts. It is believed that people take a long time to get a job in the situation that they receive high benefits now that it pays less for them to work. This means that the higher the unemployment benefits the higher the total unemployment rates as people will be reluctant to look for work (Beardon 1983, p 7) EU Budget Finland Budget Revenue 2007-2011 (€ MN) Heading Amount (euros millions) 2007 2008 2009 2010 2011 Sugar levies -0.5 1.2 1.0 0.9 1.0 Custom duties ( 187.8 215.1 152.2 168.5 202.2 Collection costs -49.6 -55.6 -38.3 -42.3 -50.8 VAT 260.7 246.1 237.2 226.7 266.9 GNI 1,087.7 1,126.6 1,203.5 1,255.4 1,435.5 UK Budgetary Imbalance 132.0 170.4 134.6 80.6 87.1 Other national contributions and adjustments TOTAL 1,629.4 1,710.0 1,813.9 1,702.2 1,955.2 The EU budget is a tool used to set up and gives authority to the total revenue and expenditure that has been deemed necessary for the EU. This budget is both established and implemented in accordance with the unity principles, annuality, budgetary accuracy, universality, unit of account, transparency and sound financial management. Such a budget presents the EU appropriations as well as the resources by purpose (Kulovesi, 2000, p. 520). The budget is normally made up of a statement of revenue. The revenue consists of own resources that are normally derived from custom duties, national VAT and the GNP contribution. From the above table, it is clear that the largest contribution by Finland to the EU is GNI, followed by VAT then custom duties. The GNI forms the largest share of the EU budget as it is the percentage is normally levied on every member state of the GNI with its rates remaining fixed during the procedures of the budget. The GNI own resource needed depends on the difference arising between the total of all the revenue and the total expenditure. The amount is normally large hence it demands that the member countries with Finland inclusive to contribute more compared to the other revenues and this amount keeps on increasing every year following the increase in spending as well as the GDP of the member state. The higher the GDP the higher the contribution to the EU. The amount of revenue paid by Finland in terms of custom duties to the EU has been fluctuating over the years with the latest figures in 2011 being placed at 202.2 million euros. This amount is high following the large amount of exports Finland takes to the EU. Explain What EU budget Spending is? Finland EU Budget Spending 2007- 2011 (€ MN) Column6 Heading Amount (euros millions) 2007 2008 2009 2010 2011 1 Sustainable growth 416.7 448.8 399.5 362.7 457.4 1a Competitiveness for growth and employment 94.6 235.1 205.6 209.3 153.9 1b Cohesion for growth and unemployment 322.0 213.7 193.9 153.4 303.6 .Structural funds 322.0 213.7 193.9 153.4 303.4 Convergence objective 114.6 50.1 0.0 0.0 24.9 Regional competitiveness and employment objective 183.5 136.3 184.2 147.7 261.6 European territorial cooperation objective 23.9 24.6 8.1 4.9 16.8 Technical assistance 0.0 2.7 1.6 0.8 0.0 .Cohesion fund 0.0 0.0 0.0 0.0 0.0 2 Preservation and management of natural resources 972.8 839.8 766.7 908.2 794.6 .Market related expenditure and direct aids 587.3 559.4 561.9 599.1 497.2 .Agriculture markets 586.3 558.6 561.1 598.6 496.4 Direct aids 547.9 543.4 545.3 540.1 539.0 Export refunds 32.8 6.6 5.8 9.3 0.1 Storage -5.1 0.0 0.5 33.9 -52.3 Other 10.7 8.6 9.5 15.2 9.6 Rural development 372.1 273.8 191.4 300.0 285.9 3 Citizenship, Freedom, Security and Justice 10.9 11.5 19.8 15.3 16.0 3a Freedom, Security and Justice 2.1 4.9 11.1 6.1 9.6 3b Citizenship 8.8 6.6 8.7 9.2 6.3 4 The EU as a global partner 0.0 0.0 0.0 0.0 0.0 5 Administration 23.1 21.1 21.8 23.4 25.0 TOTAL 1,423.4 1,321.3 1,207.8 1,309.6 1,293.0 The total amount Finland has been receiving from the EU and directs it to its budget spending has been reducing over the years as in 2007 the total amount was at 1,423.4 million euros while in 2011 the amount had decreased to 1, 293.3. The amount received is spent most on preservation and management of its natural resources and the least on storage. These funds are facilitated by the Common Agricultural Policy (CAP) as it is the agriculture and natural resources that Finland directs most of the money it receives. It is a significant CAP as assists thousands of employees in the agriculture sector in Finland in terms of direct aids which sum up to averagely 540.0 million euros, storage and export funds for their products. In accordance to the Rome Treaty as well as the regional policy, Finland spends a significant amount on rural development with the latest figure being 285.9 million euros in 2011. The EU regional policy termed as the Cohesion Policy is aimed at improving the economic situation of EU regions as well as avoiding disparities in such regions. More than a third of the budget is normally devoted to the policy aiming at removing social, economic and territorial disparities and restructuring industrial areas that are declining as well as diversifying rural areas facing decline agriculture. This brings into question the rural development especially in terms of agriculture and this can be seen with the amount contributed by Finland for this. Agriculture and Regional Conditions Finland has been regarded as the northernmost agricultural nation globally. This follows its favorable conditions that support agriculture. Such conditions include; its location falling under the 60th and 70th latitude parallels (Jaaskinen 2000, p 423). A quarter of the Finland surface is on the north of the Arctic Circle. Its regional location also facilitates agricultural activities and market for its products as borders Norway, Russia and Sweden with Baltic Sea bordering it on the south and west. Of the total surface, more than 86 percent is covered with forest living only 8% of it available for farming. Following the soil and climatic conditions, the main agricultural products are special crops and cereals mainly to the west and south and dairy husbandry to its north and east. Europe 2020 Elements 2005 2008 2009 2010 2011 2012 Aging population to be employed 73 75.5 73.5 73 73.8 74 Gross domestic expenditure 3.48 3.7 3.94 3.9 3.78 Education and training 10.3 9.8 9.9 10.3 9.8 9.8 Poverty or social exclusion 17.2 17.4 16.9 16.9 According to Finland’s objective of having the rate of the aged population who are unemployed to get over 75%, this target seems out of reach as the latest figures in 2011 show that the percentage is at 74. In order to achieve its objective, Finland as a nation should take more measures in an effort to achieve costs savings and productivity gains in public service provision so as to meet the challenges facing the aging population unemployment. Its gross domestic expenditure as well as social exclusion are still way far from its objective and to respond to this, the country should enhance its competition in service and product markets more so on retail sector through ensuring that the Competition Act and the health competition program are implemented effectively. In order to improve its external competition and productivity growth, the country should enhance its efforts to diversify its business structure. With regards to training and education, although the trend is not bad, more institutions and schools have to be set up to met the increasing population (Lionel, 2000, p 52). Conclusion Finland economic policies have been greatly affected by those of the EU now that it is among its member states. Its membership in the EU has led Finland to be open to international investment and trade and its investment regulations remain efficient and transparent. The EU policies have enable Finland to come up with a well developed financial system that competes well globally and offers a wide services range. Its banking sector remains sound regardless of the global financial markets strains. Finland has developed to become a leading example in relation to its economic performances and its innovative and competitiveness successes. Its economy which had earlier been challenged by a collapse in its exports, it recovered with its driving factors being the semi-furnished goods and its processing industry that were stimulated by both domestic and foreign demand. The stimulus and crisis measures have had durable and profound effects on its debt levels and public finances levels. The main challenge still facing the country is the putting together of the measures meant to promote growth as well as measures that will allow for the rebalancing of its accounts. One of its long term strategies is to have the aging population to be a source of pressure on its spending (Magnus, 2000, p 82). The GDP of Finland has stood out as being among the highest around the worlds thus being characterized by high living, social and economic standards. Its distribution of wealth is considered as being fair but its social inequalities is seen as a rising challenge in the country. Its membership as a member of the EU has had more benefits to the country as it has placed it in a strategic economic position at the center of the euro zone that is dynamic with its economic orientation on high research, economic and development. Bibliography Baldwin, R & Portes, R., 1997. “ The costs and benefits of eastern enlargement: the impact on the EU and central Europe”, Economic Policy, vol 12 (24), 125-176 Beardon, M. (1983). Empirical Evidence on Marketplace Alienation. Journal of Micromarketing, 3, 6-20. Forfattare, T., 2008. “The attractiveness of Finland in the host- country screening of inward foreign direct investment’ University of Helsinki Gerstner, E. (1986). Profitable Pricing when Market Segments Overlap. Marketing Science, 5, 55-69. Jaaskinen, N., 2000. “ The Application of Community law in Finland, Common Market Law Review, 36 (2):PP.401-441 Kulovesi, K., 2000. International Relations in the New Constitution of Finland, 69 Nordic Journal of International Law, 513-522 Lionel, F., 2000. “Intra-industry Trade and the Single Market: Quality Matters” CEPR Discussion Papers. Magnus, H., 2000. ‘Growth Effects of European Integration” Working Paper Series 439, Research Institute of Industrial Economies O’Sullivan, A., Sheffrin, S., & Prerez, S. (2009). Survey Of Economics: Principles, Applications And Tools. New York: Pearson-Prentice Hall. Raunio, T & Tilikainen, T., 2003. Finland in the European Union, FrankCass: London Tutkimuslaitos, P. , 2008. ‘Does outward foreign direct invest reduce domestic investment”, Labor Institute for Economic research   Read More
Cite this document
  • APA
  • MLA
  • CHICAGO
(“The impact of EU membership on Finland Research Paper”, n.d.)
Retrieved from https://studentshare.org/macro-microeconomics/1477210-the-impact-of-eu-membership-on-finland
(The Impact of EU Membership on Finland Research Paper)
https://studentshare.org/macro-microeconomics/1477210-the-impact-of-eu-membership-on-finland.
“The Impact of EU Membership on Finland Research Paper”, n.d. https://studentshare.org/macro-microeconomics/1477210-the-impact-of-eu-membership-on-finland.
  • Cited: 0 times

CHECK THESE SAMPLES OF The impact of EU membership on Finland

EU Enlargement to Eastern Europe

nbsp;  The economies of these three countries were in such great shape that their eu membership influenced an increase in the union's per capita income.... nbsp;  The decision to enlarge eu membership to Eastern European countries was finalized in 2002 and its first phase would have been carried out between 2004 and 2006.... nbsp; Eastern Europe is a low-income region of about 100 million people whose combined income will raise the GDP of eu by a mere 5 percent....
8 Pages (2000 words) Essay

Transit Country for Energy Supplies

The country has played a crucial role as a key transit country for energy supplies, and its membership into European Union will honor the forum.... The membership will provide the European Union with an opportunity to develop linkages with the Central Asian countries, and this will further provide an easy access to the European Union towards the enormous wealth of resources in Central Asia and regions of Siberia.... The role of the European Union is expected to get further strong and influential, and its emergence as the foreign policy actor, will impact the world politics considerably after the accession of the Turkey....
9 Pages (2250 words) Essay

European Business Environment

The 12 nations of the EC (Belgium, Denmark, France, Germany, Greece, Ireland, Italy, Luxembourg, the Netherlands, Portugal, Spain, and the UK) were joined by Austria, Sweden, and finland in 1995 and by (Greek) Cyprus, the Czech Republic, Estonia, Hungary, Latvia, Lithuania, Malta, Poland, Slovakia, and Slovenia in May 2004.... The UK became a member of the EC (now the eu) in 1973.... The European Union (eu) refers to the 25 nations that have joined together to form an economic community (EC), with some monetary, political, and social aspirations....
14 Pages (3500 words) Essay

Human Resource Development at Eurocompanies

The multidisciplinary nature of what is contended to be HRD makes attempts to precisely define HRD difficult.... There is some evidence in the literature of ideological or descriptive-normative models for aspects of HRD.... For example Walton (1999) has identified 'Strategic HRD' as a distinctive and almost freestanding dimension of HRD....
9 Pages (2250 words) Essay

Turkey and the European Union

We will explore the domestic and historical factors which make Turkey a poor candidate for eu membership and will conclude with a broad overview of our overall analysis (Warleigh 13; Fierke & Wiener 1-24).... Although there were initially only five members of the precursor to the European Union (Belgium, France, Italy, Luxembourg, Netherlands, and West Germany), there are presently 27 countries in the EU and they are, in alphabetical order, Austria, Belgium, Bulgaria, Cyprus, Czech Republic, Denmark, Estonia, finland, France, Germany, Greece, Hungary, the Republic of Ireland, Italy, Latvia, Lithuania, Luxembourg, Malta, the Netherlands, Poland, Portugal, Romania, Slovakia, Slovenia, Spain, Sweden, and finally, the United Kingdom....
8 Pages (2000 words) Coursework

Impact of the European Union on Employment Relations

The paper "impact of the European Union on Employment Relations" states that while the contract law has brought numerous changes in the employment relations, there are workers who are outside the scope of this protection and they continue to suffer under the traditional British employment laws.... In 1992, the European Economic Area was characterized by accord on eastern expansion and 1995 saw Austria, finland, and Sweden becoming fully fledged members of the EU....
9 Pages (2250 words) Research Paper

Should the United Kingdom remain in the European Union

According to Nigel's argument, the Swiss model is better than membership in the European Union and it is time for the UK to leave the EU.... On the other hand, those in favour of continued membership in the EU assert that countries like Norway and Switzerland still abide by the EU rules without any influence on their formation.... Thesis statement: the costs of the UK's membership in the EU far outweigh the benefits and it is time to leave the EU....
7 Pages (1750 words) Essay

Why Finland and Sweden Have Not Sought Full Membership of NATO

3), as a result of which they became members of eu Common foreign and security policy (CFSP) (Sjursen 1998, p.... This work "Why finland and Sweden Have Not Sought Full Membership of NATO" describes the reasons why Sweden and finland have not sought full membership in NATO despite being part of the North Atlantic area and faced some threat of attack.... Some of the reasons why Sweden and finland have failed to seek full membership of NATO are because of the change of national policies....
12 Pages (3000 words) Essay
sponsored ads
We use cookies to create the best experience for you. Keep on browsing if you are OK with that, or find out how to manage cookies.
Contact Us