StudentShare
Contact Us
Sign In / Sign Up for FREE
Search
Go to advanced search...
Free

Measures and Scale - Statistics Project Example

Cite this document
Summary
Values of the correlation coefficient are range between -1 and +1. When the correlation coefficient is +1, this means that two variables are perfectly related in a positive…
Download full paper File format: .doc, available for editing
GRAB THE BEST PAPER93.3% of users find it useful
Measures and Scale
Read Text Preview

Extract of sample "Measures and Scale"

Running Head: Measures and Scale Measures and Scale Measures and Scale Introduction Correlation coefficient measures the linear association between two variables (Ott & Longnecker, 2010). Values of the correlation coefficient are range between -1 and +1. When the correlation coefficient is +1, this means that two variables are perfectly related in a positive linear sense. A correlation coefficient of -1 indicates that the two variables are perfectly related in a negative linear sense. 0 correlation coefficient indicates that no linear relationship between the two variables.

Regression analysis identifies the relationship between a dependent variable and independent variables. Various tests have been employed to determine if the regression model is satisfactory. The model is said to be satisfactory, if the estimated regression equation can predict the value of the dependent variable given values for the independent variables. The relationship between these two measures is that they analyze the extent to which variables are related. However, these two do not assess cause and effect.

Exploring the relationship between stress and blood pressureStress is part of normal life though too much stress can cause emotional, psychological and physical problems such as heart disease, irregular heart, chest pains and high blood pressure (Quinn & Keough, 2002). Our main concern is to study the relationship between stress and high blood pressure. We want to ascertain whether medical researchers are right with regard to stress causing high blood pressure. Let us determine the relationship of these two by using a sample of 20 patients who had their stress test score and blood readings taken.

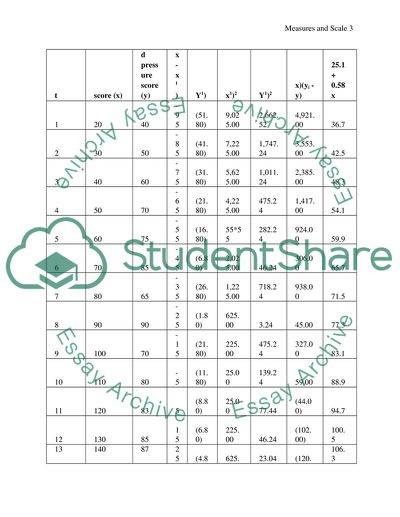
Regression and correlation is used in ascertaining the relationship as shown below:Patientstress score (x)Blood pressure score (y)(x-x1)(Y-Y1)(x-x1)2(Y-Y1)2(xi - x)(yi - y)ŷ = 25.1 + 0.58x 12040-95 (51.80) 9,025.00 2,662.52 4,921.00 36.723050-85 (41.80) 7,225.00 1,747.24 3,553.00 42.534060-75 (31.80) 5,625.00 1,011.24 2,385.00 48.345070-65 (21.80) 4,225.00 475.24 1,417.00 54.156075-55 (16.80) 55*55 282.24 924.00 59.

967085-45 (6.80) 2,025.00 46.24 306.00 65.778065-35 (26.80) 1,225.00 718.24 938.00 71.589090-25 (1.80) 625.00 3.24 45.00 77.3910070-15 (21.80) 225.00 475.24 327.00 83.11011080-5 (11.80) 25.00 139.24 59.00 88.911120835 (8.80) 25.00 77.44 (44.00)94.7121308515 (6.80) 225.00 46.24 (102.00)100.5131408725 (4.80) 625.

00 23.04 (120.00)106.3141509035 (1.80) 1,225.00 3.24 (63.00)112.1151609245 0.20 2,025.00 0.04 9.00 117.9161709455 2.20 3,025.00 4.84 121.00 123.71718010065 8.20 4,225.00 67.24 533.00 129.51819014075 48.20 5,625.00 2,323.24 3,615.00 135.31920016085 68.20 7,225.00 4,651.24 5,797.00 141.12021022095 128.20 9,025.00 16,435.24 12,179.00 146.9Total230018360 - 63,475 31,192.

5 36,800 1,836.00 Mean (x1)11591.8      Correlation1       Regressionŷ = b0 + b1x        b1 = Σ [ (xi - x)(yi - y) ] / Σ [ (xi - x)2]        b1=0.58       b0 = y - b1 * x25.1       ŷ = 25.1 + 0.58x .       From the above workings in the table, the correlation coefficient is one. Therefore, the relationship between stress and blood pressure is a linear one. This simply means that when stress levels increase, the blood pressure also increases.

The regression model is determined is fit as we were able to predict the values of blood pressure at given levels of stress.Relationship between BMI (Kg/m2) of pregnant mothers and the birth-weight (BW in Kg) of their newborn The following data set provide information on 6 pregnant mothers who were contacted for this study  BMI Birth weight(x-x1)(Y-Y1)(x-x1)2(Y-Y1)2(xi - x)(yi - y)1202.7-10.83-0.2117.28890.044.6915562302.9-0.8300.6889003503.519.170.6367.48890.36132.296445314.170.1200.78890.012.

0078895102.2-20.83-0.7433.88890.49212.605566303.1-0.830.20.68890.040.027556 18517.40.028.882E-161120.8330.94351.62857mean30.832.9     coefficient of correlation 1             b1 = Σ [ (xi - x)(yi - y) ] / Σ [ (xi - x)2]   1.776E-17   b1=0.00000     b0 = 2.9 - 0 * 30.830      ŷ = 2.9        The correlation is +1, therefore a relationship which is linear exists between BMI and birth weight. Using regression analysis, it will be not possible to predict the birth weight given the BMI because the model is ŷ = 2.9.ReferencesOtt, Lyman R.

& Longnecker, Micheal T. (2010). An Introduction to Statistical Methods And Data Analysis. Cengage learningQuinn, Gerry P. & Keough, Michael J. (2002). Experimental Design and Data Analysis for Biologists. Cambridge university press

Read More
Cite this document
  • APA
  • MLA
  • CHICAGO
(“Measures and Scale Statistics Project Example | Topics and Well Written Essays - 500 words”, n.d.)
Measures and Scale Statistics Project Example | Topics and Well Written Essays - 500 words. Retrieved from https://studentshare.org/statistics/1611669-measures-and-scale
(Measures and Scale Statistics Project Example | Topics and Well Written Essays - 500 Words)
Measures and Scale Statistics Project Example | Topics and Well Written Essays - 500 Words. https://studentshare.org/statistics/1611669-measures-and-scale.
“Measures and Scale Statistics Project Example | Topics and Well Written Essays - 500 Words”, n.d. https://studentshare.org/statistics/1611669-measures-and-scale.
  • Cited: 0 times

CHECK THESE SAMPLES OF Measures and Scale

The Yale and Brown Obsessive Compulsive Scale as a Measure of OCD

The Yale–Brown Obsessive Compulsive scale as a measure of OCD Obsessive – compulsive disorder (OCD) is a condition characterized by a variety of symptoms that prompt the individual to indulge in repetitive actions as a means to reduce anxiety.... In an attempt to identify individuals who require treatment for OCD and to verify the severity of the person's symptoms; Dr Goodman and his colleagues (Goodman, Price & Rasmussen; 1989) designed a scale that could be used to screen individuals with OCD as well as to be used to gauge progress of the individual across different points in therapy....
7 Pages (1750 words) Essay

The Wechsler Intelligence Scales

The Wechsler Adult Intelligence scale Developed by David Wechsler, a psychologist at Bellevue Hospital, the Wechsler Intelligence Scales have been variously revised since their first publication in 1939.... There have been several revisions to improve the test ability of the scales and to include more population groups since Wechsler published the first scale in 1939.... The scale is in its third edition, and is designed for individuals aged between 16 and 89 years (Pearson Assessments, 2011)....
4 Pages (1000 words) Research Paper

State Coordinating Boards and accountability measures

It also discusses the recent decentralization measures that have been undertaken by the Government.... Therefore, there is an accountability that is being demanded of these organizations, through the use of external evaluation and performance measures to assess the quality of the education that is being imparted and the effectiveness of policy outcomes....
10 Pages (2500 words) Essay

Outcome Measures in Audiology Rehabilitation

Outcome measures can be put as being objective or subjective.... Usages of self-report measures are beneficial in that they act as facilitation to hearing aid fittings for an individual.... Moreover, such measures remain very crucial in clinical decisions....
10 Pages (2500 words) Essay

The Measure Stage -- General Electric

This is an indication that stringent measures ought to be taken in order to curb customer complaints within the company.... For this reason, customer satisfaction becomes the primary focus for this section.... As already mentioned in the previous process definition section, the General Electric Company hopes to achieve customer… They include process, customer and employees....
2 Pages (500 words) Coursework

Topic: validity and its influence

Construct validity is the reliability or the trustworthiness of the scale to test a theoretical concept while content validity refers to testing of the actual elements in a study using a specific instrument.... For instance, the post demonstrates how changing the content of the NPI scale affects the study results.... Construct validity is the reliability or the trustworthiness of the scale to test a theoretical concept while content validity refers to testing of the actual elements in a study using a specific instrument....
2 Pages (500 words) Essay

The Use of Surveying in Mapping Features within the Physical Landscape

he applicability of morphological mapping depends on the scale and resolution of the elevation data and the scale of the features to be investigated.... Conversely, the study of the continental- to global-scale topographic relief may prove too cumbersome if 1:50000 maps are used....
6 Pages (1500 words) Term Paper

The Concept of Questionnaire Design by Highlighting the Major Steps in Avoiding Mistakes

The purpose of this study is determined by the information the investigator needs.... This information could be either qualitative or quantitative in cases where the researcher wants to quantify hypotheses and the information has to be analyzed statistically.... hellip; A well-developed questionnaire should be made according to the research objectives stated....
11 Pages (2750 words) Essay
sponsored ads
We use cookies to create the best experience for you. Keep on browsing if you are OK with that, or find out how to manage cookies.
Contact Us