StudentShare
Contact Us
Sign In / Sign Up for FREE
Search
Go to advanced search...
Free

Sample Statistic, p-value, Confidence interval - Assignment Example

Cite this document
Summary
A sample statistic is calculated numerical value that characterizes some aspect of sample set of data, often meant to estimate the real value of the corresponding parameter in an underlying population…
Download full paper File format: .doc, available for editing
GRAB THE BEST PAPER98.7% of users find it useful
Sample Statistic, p-value, Confidence interval
Read Text Preview

Extract of sample "Sample Statistic, p-value, Confidence interval"

1) What is the null hypothesis (H0) tested? H0: π ≤ 0.5 2) What is the alternative hypothesis (H1)? H1: π > 0.5 3) Sample statistic: a. What isthe meaning of the sample statistic? A sample statistic is calculated numerical value that characterizes some aspect of sample set of data, often meant to estimate the real value of the corresponding parameter in an underlying population. What is its value? 0.05 4) Test statistic: a. What is the meaning of the test statistic?  The test stat is the distance of the sample proportion from the population proportion in standard errors of the distribution of the test statistic b.

What is its value? 0.8944 5) Critical values: a. What is the meaning of critical value? Critical value(s) is a factor used to compute the margin of error. Critical value(s) of the test statistic bounds the rejection region(s) of probability alpha = the risk we are willing to take of rejecting H0 when H0 is true b. What is (are) the critical value(s)? Critical lower value is 1.6449 c. Compare the test statistic to the critical value(s). Is there sufficient evidence to conclude the test subject is an expert?

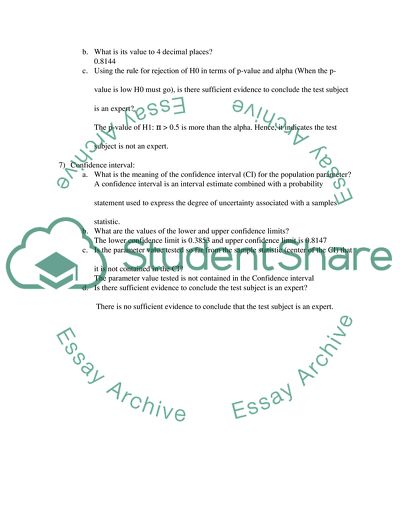
The test statistic does not exceed the critical values. Hence, there is no sufficient evidence to conclude that the test subject is an expert. 6) p-value: a. What is the meaning of the p-value? P-value is a probability that measures the strength of evidence in support of a null hypothesis. b. What is its value to 4 decimal places? 0.8144 c. Using the rule for rejection of H0 in terms of p-value and alpha (When the p-value is low H0 must go), is there sufficient evidence to conclude the test subject is an expert?

The p-value of H1: π > 0.5 is more than the alpha. Hence, it indicates the test subject is not an expert. 7) Confidence interval: a. What is the meaning of the confidence interval (CI) for the population parameter? A confidence interval is an interval estimate combined with a probability statement used to express the degree of uncertainty associated with a samples statistic. b. What are the values of the lower and upper confidence limits? The lower confidence limit is 0.3853 and upper confidence limit is 0.8147 c. Is the parameter value tested so far from the sample statistic (center of the CI) that it is not contained in the CI?

The parameter value tested is not contained in the Confidence interval d. Is there sufficient evidence to conclude the test subject is an expert?  There is no sufficient evidence to conclude that the test subject is an expert. Fall 2015

Read More
Cite this document
  • APA
  • MLA
  • CHICAGO
(“Sample Statistic, p-value, Confidence interval Assignment”, n.d.)
Sample Statistic, p-value, Confidence interval Assignment. Retrieved from https://studentshare.org/statistics/1701244-sample-statistic-p-value-confidence-interval
(Sample Statistic, P-Value, Confidence Interval Assignment)
Sample Statistic, P-Value, Confidence Interval Assignment. https://studentshare.org/statistics/1701244-sample-statistic-p-value-confidence-interval.
“Sample Statistic, P-Value, Confidence Interval Assignment”, n.d. https://studentshare.org/statistics/1701244-sample-statistic-p-value-confidence-interval.
  • Cited: 0 times

CHECK THESE SAMPLES OF Sample Statistic, p-value, Confidence interval

Descriptive statistics

For example, if a study indicates a confidence interval of 95%, then the reader is able to determine that the values or the assessment given in the study is true for the population 95% of the time.... The shorter the confidence interval, the more accurate is the assessment (Maki, 2006).... In this case, although the 9 lb weight loss arrived at was essentially just an estimate, the confidence interval that was set for the trial was able to quantify the uncertainty that was associated with that estimate (Malone, 2001)....
3 Pages (750 words) Essay

Exploring Inferential Statistics and Their Discontents

3 e) Ho will be rejected since t-test is not applicable f) lack of standard deviation makes determination of 95% confidence interval impossible since it requires sample mean +/- t critical value*s/sqrt n 4.... 45 e) Ho will be rejected if the computed t value is greater than the critical value f) 95% confidence interval for u can be achieved by applying the subsequent formula.... Statistical test: a two-proportion t-interval b.... sample size=60, sample mean = 1....
8 Pages (2000 words) Assignment

Hard Statistics Quiz

Answer: A discrete variable can assume only a countable number of values such as number of persons in a family, whereas a continuous variable can assume any numerical value over a certain interval or intervals (uncountable number of values) such as height of a person.... In hypothesis testing, the p-value can be thought of as the chance of obtaining the observed results, or more extreme results, if the... ± 68% of the sample lies within one standard deviation of the mean; 34% above and 34% below ± 96% within two standard deviations: 48% above and 48% below ± 99....
18 Pages (4500 words) Essay

Comprehensive Statistics

interval data- in this level of measurement the distance between ranks has a meaning, data can be ranked and at the same time the distance has meaning, for example, temperature data is interval data where temperature difference has meaning.... This assignment "Comprehensive Statistics" discusses four levels of measurement data, the advantages and disadvantages of the bar chart, pie and Pareto diagram, the mean, mode and median as measures of central tendencies of data, the empirical rule and mutually exclusive and collectively exhaustive events....
6 Pages (1500 words) Assignment

Recearch paper 2

3, which was 95% confidence interval (Psaty & Kronmal, 2008).... 5 and a 95% confidence interval that makes the data range between 1.... Lastly, the third confidence interval was in the case of 3-fold increase for mortality having a HR of 2.... 9 with a confidence interval of 95% making the data to lie somewhere in between 1.... From these three examples of confidence intervals, all of them have the strongest evidence as they range at 95% confidence interval....
2 Pages (500 words) Statistics Project

Statistics class

The confidence interval also has a very high range of values and so it means that the proportion can be between 30% to 58% of the customers.... The confidence interval is (10.... he confidence interval level is (0.... The sample mean annual income of the credit customer is around $44,000 and as the sample is a large enough, the estimation for the population mean… As the test statistic value was less than the z-value, we rejected the null hypotheses that mean annual income is $50,000 and accepted the alternate hypotheses of income to be less than $50,000....
6 Pages (1500 words) Assignment

Confidence Intervals and Hypothesis Testing

5 while for constructing confidence interval a 95% confidence level was chosen.... This statistics project "confidence Intervals and Hypothesis Testing" attempts to explore the various statistical measures using  a data collected from a randomly selected sample of size 100.... nbsp;… In order to ensure the randomness of our chosen sample whole university student names were collected and then using a random number, a sample was drawn of size 100....
5 Pages (1250 words) Statistics Project

Companies Statistics Analysis

The assignment "Companies Statistics Analysis" focuses on the critical multifaceted analysis of the statistical data of several companies operating in the aviation market.... The calculations and procedures of the analysis are reflected in the excel sheet.... hellip; The main questions on the contingency table are: What is the probability that any of the companies selected is below the Average?...
8 Pages (2000 words) Assignment
sponsored ads
We use cookies to create the best experience for you. Keep on browsing if you are OK with that, or find out how to manage cookies.
Contact Us