StudentShare
Contact Us
Sign In / Sign Up for FREE
Search
Go to advanced search...
Free

Determinants of Customer Satisfaction in the Hotel Industry - Dissertation Example

Cite this document
Summary
The paper "Determinants of Customer Satisfaction in the Hotel Industry" highlights that the quality of the safe box has been considered. Even though some customers did not exactly think that hotels should be calm and silent, the mass believes that the hotels should be easily reachable…
Download full paper File format: .doc, available for editing
GRAB THE BEST PAPER92.3% of users find it useful
Determinants of Customer Satisfaction in the Hotel Industry
Read Text Preview

Extract of sample "Determinants of Customer Satisfaction in the Hotel Industry"

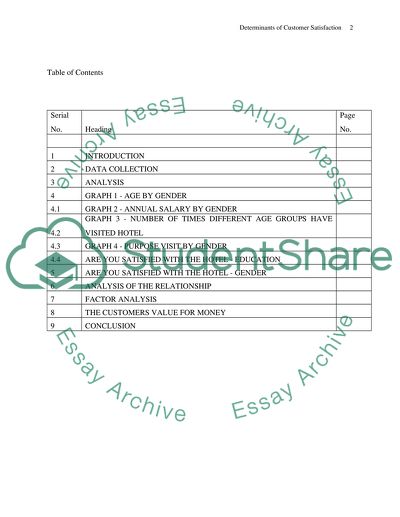
?Determinants Satisfaction Determinants Satisfaction in the Hotel Industry Table of ContentsSerial No. Heading Page No.       1 INTRODUCTION 2 DATA COLLECTION 3 ANALYSIS 4 GRAPH 1 - AGE BY GENDER 4.1 GRAPH 2 - ANNUAL SALARY BY GENDER 4.2 GRAPH 3 - NUMBER OF TIMES DIFFERENT AGE GROUPS HAVE VISITED HOTEL 4.3 GRAPH 4 - PURPOSE VISIT BY GENDER 4.4 ARE YOU SATISFIED WITH THE HOTEL - EDUCATION 5 ARE YOU SATISFIED WITH THE HOTEL - GENDER 6 ANALYSIS OF THE RELATIONSHIP 7 FACTOR ANALYSIS 8 THE CUSTOMERS VALUE FOR MONEY 9 CONCLUSION 1. INTRODUCTION In the recent years research relating to customer satisfaction in the service industries has increased dramatically (Peterson and Wilson, 1992). This has been accredited due to an increase in the growth of service industries (Danaher and Haddrell, 1995). Hotels being part of service industries have thus witnessed an increased effort to enhance customer satisfaction and thus customer satisfaction measurement has become an important ‘part and parcel’ of a hotels success. The purpose of this research is to discover and recognize the determinants of customer Satisfaction (Shih, 1986; Yau and Chan, 1990; Stevens, 1992; Mok et al., 1995). 2. DATA COLLECTION Distribution of survey questionnaires to a sample size of 300 participants were given with varying nationalities and age groups. One of the very important advantages of sampling is reliability and can also be used to check the accuracy of the survey data .Around 600 surveys were distributed and out of 600 surveys 350 were returned which is roughly (58.4%) of 600 surveys distributed. Among the survey distributed, 300 (50%) were usable. The questionnaires were distributed in Bournemouth city centre areas.3 star hotels namely - Queens’s hotel, Britannia Hotel, Royal Exeter hotel, and Premier inn Hotel etc. 4 Stars Hotel - park central hotel, Norfolk Hotel, Carlton Hotel, Royal bath hotel, Blue Palm and Marriott hotel etc.Survey was conducted by asking customers around lounge areas, restaurants and pub. Also requested receptionist to collect data from customers and gave (traditional souvenirs) to the receptionists. After nearly two months of survey (20th June till 10th August 2011), for data analysis IBMSPSS was engaged 4.1 ANALYSIS 4.1.1 Age by gender Graph 1 As seen in graph1 above which is related to age by gender, it can be observed that until the age of 50, male visitors outnumbered female visitors by a small margin, but after age 50 it can be seen that female visitors have increased as compared to male visitors. It is also to be observed that a reverse scenario has occurred where as female visitors have constantly increased with an increase in their age, male visitors have declined with an increase in their age. The majority of visitors range from ages 21 to 30 in both males and females while fewer than 20 visitors were around 20% less than ages 21 to 30 figures. Male visitors above 61 visited the hotels least frequently, even less than their female counterpart of same age and likewise girls under 20 are the least frequent female visitors, even less than their female counterparts of same age. 4.1.2 Annual Salary by Gender Graph 2. As far as annual salary by gender is concerned below, it can be observed that as far as under 5000 is concerned, females are above 20% than males while from 5000-15000 and 15000-25000 again females have surpassed males where females are above 50% but below 60% while males above 40% but below 50%, but a changing trend could be seen for annual salary of 25000-45000 where females are hardly near 40 % but males have surpassed 60% which means that males are higher earners than females in this category . moving forward to a range from 45000 – 60000 annual salary, percentage of both males and females are equal thus females had been giving a tough competition in this category .At a salary of above 60000 the biggest percentage difference could be seen between males and females where males are almost 40% more than females. Thus overall it could be observed that the percentage of males have in general increased with a rise in salary giving them a higher purchasing power. 4.1.3 Number of times different age groups have visited hotel Graph 3. Three variables have been used on the x-axis ‘this is my first time’, ‘twice’, ‘more than twice’. It can be clearly observed that the hotels have high number of first visitors.this could be due to reference, advertizing or both thus increasing the role of market strategy for these hotels. Around 70 % of the customers are first timers while this drops to a staggering 20% for the hotel visits again and 10 % for more than twice. A steep drop from 70% to 20% could be due to non satisfaction with the customer services or marketing strategy not focusing on old customers. It could be seen that there are high number of male visits first time than female visits but with a rather slight difference in percentage. however this is reversed for a visit again with females visiting more than males and same followed for visit more than twice. This side needs to be further researched mainly to evaluate the attributes that may make females averse to readily visit new places and prefer to go to places they have already visited. What needs to be explored further is that this situation is brought on by service value or some other factor exclusive to the female psychology that is unrelated to the service value and performance. 4.1.4 Purpose visit by gender Graph 4. It could be observed that both male and female prefer hotels mostly for holidays especially females who visit more than males for holidays and have surpassed 50%. Second in line come visits with family and friends where equal percentage of males and females visit which is close to 20%. This is followed by business leisure’s and study where males are more than females. It could also be seen that females prefer hotels for study more than males rather than for business purpose. Surprisingly, more females conference at hotels than men, while a lesser number of females use the hotel for hosting exhibitions. 4.2 Frequency (special case: Two-way contingency) Chi-Square Test- Education “Are you satisfied with this hotel”?   Are you satisfied with this hotel? total Strongly dissatisfied Dissatisfied Neutral Satisfied Strongly satisfied Secondary Schools or equivalent 1 1 12 32 12 58 University or College 6 5 33 104 41 189 Masters 1 0 8 23 9 41 Doctorate or above 1 1 1 5 3 11 7 0 0 0 1 0 1 total 9 7 54 165 65 300 As it can be seen in the overall satisfaction towards education sector, the majority of respondents (around 82.3%) are university or colledge attendees and have given there opiniouns very positively and downright. The least number of respondents are above the doctorate level from the cateogary of education. All the survey questionaries are filled out and non missing. The table shows the divergence of the guest on the basis of educational backdrop with cateogaries ranging from secondary school, to universities, than master level to doctorate with a choice of anyone more qualified than a doctorate. Five options are on hand with the option of neutral satisfaction in the centre and two grades on left with a negative side and two grades on the right with a positive side. It could be observed that as far as ‘satisfied’ is concerned ‘secondary schools or equalent’ are 55 % of total 58 under this cateogary which means that they are mostly satisfied by the hotels performance. Same goes with ‘university or colledge’ where they not only make up 55% of satisfied when compared with 189 respondents but also 34.6 % of total 300 respondents which send a strong signal regarding number of ‘satisfied’. For ‘masters’ cateogary, satisfied are 56% of 41 respondents and ‘doctorate and above’ 45.5%. For ‘strongly satisfied’, university or colledge make up most of it in quantitative terms that is around 41 and is 21.7% of total 189 respondents. Second most in quantitative terms are secondary school or equalent which are 18.4 % of total ‘strongly satisfied’ people. Then come ‘masters’ and ‘doctorate and above’ who are 13.8 % and 4.16 % of total ‘strongly satisfied’. Strongly dissatisfied and dissatisfied shows the least activity with ‘university or colledge’ showing 66.7% of total ‘strongly dissatisfied’ and 71.4% of total ‘dissatisfied’ respondents. Thus it could be concluded that most of the respondents (76.6% of 300) are ‘satisfied’ or ‘strongly satisfied ‘with the hotel meaning that hotels are being able to meet their customers satisfaction while 18% of 300 being ‘neutral’ and roughly 6 % of 300 ‘strongly dissatisfied’ or ‘dissatisfied’ with the hotel. 4.3 Frequency (special case: Two-way contingency) Chi-Square Test – Gender “Are you satisfied with this hotel”?   Are you satisfied with this hotel? total Strongly dissatisfied Dissatisfied Neutral Satisfied Strongly satisfied male 7 4 26 79 25 141 female 2 3 28 86 40 159 total 9 7 54 165 65 300 The same horizontal row has been used which includes ‘strongly dissatisfied’, ‘dissatisfied’ ‘neutral’, ‘satisfied’ and ‘strongly satisfied’. While the vertical column has been altered by including gender wise data rather than education wise. From the assessment of the table it could be firstly seen that 100% of the respondents contributed in the survey. The tabulation shows that out of 300 respondents 141 are males which make up around 47.5% of the total population. The females make up 159 in quantitative terms or otherwise 53%. It can be clearly observed that the females are more eagerly or better satisfied than males .As far as ‘strongly satisfied’ is concerned, 17.7% of the males are ‘strongly satisfied’ when compared to total males and 25% of the females are ‘strongly satisfied’ when compared to total females.on the opposite side of the band, looking at the option of ‘strongly dissatisfied’, round about 5 % of the males are strongly dissatisfied ( as a percentage of total males) and only 1.25% of the females are strongly dissatisfied (as a percentage of total females). Keeping all other factors invariable, what needs to be further explored is the difference shown by males and females regarding the hotel experience and whether this difference exists because of the hotel service quality or a psychological makeup that differentiates perception and expectations between males and females. 4.4 Analysis of the Relationships Coefficients Model Unstandardized Coefficients Standardized Coefficients t Sig. B Std. Error Beta 1 (Constant) 2.062 .223 9.237 .000 Are you satisfied with staff service quality of this hotel? .480 .057 .438 8.410 .000 2 (Constant) .370 .240 1.543 .124 Are you satisfied with staff service quality of this hotel? .076 .063 .070 1.220 .223 Are you satisfied with room quality? .088 .063 .082 1.395 .164 Are you satisfied with facility service quality? .101 .060 .094 1.686 .093 Are you satisfied with business service of this hotel? .069 .050 .076 1.370 .172 Are you satisfied with value for money? .196 .056 .188 3.489 .001 Are you satisfied with security of this hotel? .029 .059 .028 .496 .621 Are you satisfied with location of this hotel? .368 .056 .362 6.555 .000 a. Dependent Variable: Are you satisfied with this hotel? Assuming values of 1, looking at the observed analysis of the service quality as represented in the table, the service quality has been broken down into component variables on which customers have commented. Looking at the cited variables it could be found that customers are pleased with the location of the hotel (variable 0.368) and consider that hotel experience gives them worth for their money. The customers are somewhat satisfied with the service quality (variable 0.101), with the staff as well as with the business services of the hotel. The least pleasing aspect seems to be the security of the hotel (variable 0.029). Many reasons could surround the problem with security personnel, with the security related amenities like poor fire alarms or emergency stairs, or it could be the quality of the safe box availability or the unavailability of the same. 4.5 Factor Analysis Communalities Initial Extraction Staff are polite and friendly .614 .694 Staff understand your requests .587 .611 Check-in/check out are efficient .486 .503 Staff have neat appearance .348 .335 Bed/mattress/pillow are comfortable .426 .486 Room is clean .444 .451 Room is quiet .402 .382 Laundry /Valet service is efficient .463 .408 Food & beverage facilities are of great variety .117 .089 Wake-up call is reliable .490 .500 Information desk is helpful .396 .375 Business-related meeting rooms are available .633 .619 Business-related facilities are available .690 .800 Secretarial service is available .460 .463 Hotel food & beverages are value for money .406 .441 Room is value for money .420 .494 Hotel is part of a reputable chain .321 .362 Hotel provides comfortable ambiance .420 .442 Security personnel are responsible .436 .416 Loud fire alarms are reliable .387 .378 Safe box is available .399 .392 Hotels should be calm and silent .442 .422 Hotels should be easily accessible .385 .398 Hotels should be hidden away (situated in quiet secluded locations) .356 .440 The location of hotels should be centred in city .339 .470 Extraction Method: Principal Axis Factoring. A total of 25 hotel factor variables were surveyed from the table above. It could be seen that a good and friendly response was received for staff with a general agreement that the staff is sweet and polite and friendly. The next variable shows an improvement from the initial, namely that the staff is compassionate and value customers request. The check in/checkout variable also shows an improvement from the initial. Equally on the other hand, for the variable of neat staff appearance the initial has gone down. The initial also shows an improvement for bed and allied facilities like pillows and mattresses. While there is also shown to be an improvement in the variable for cleanliness of the room, the calmness of the room appear to go down a bit, as did the experience of laundry/valet service. The initial for the great variety in Food and Beverages also has greatly disenchanted, although conversely customers agree that food and beverage has value for money. The reliability of the wake-up call was good (much better than food and beverages) while the information desk has room for improvement. Although the availability of business-related rooms took a dip, yet customers liked the technical facilities to go with the business rooms. 4.6 The customers value for money Many customers cherished the fact that the hotel is part of a reputable and renowned chain and many customers were happy that the hotel provides a great ambience. The security surely seemed to disappoint with the opinion that the security personnel can be improved, at the same time , fire alarm system could also be improved. The quality of the safe box has also been considered. Even though some customers did not exactly think that hotels should be calm and silent, the mass believe that the hotels should be easily reachable. They are also of the opinion that the hotel buildings should be discreet and not on the main roads, being located in the city center. 5. Conculsion Seven variables were used for the study regarding factors that influence customers’ choice , intentions which make them come back the same hotel and recommend to their friends and relatives. According to the factor analysis , location seems to make customers revisit the same hotel where they stay and recommend their friends and relatives.Thus the above variable has not only made most of the males and females ‘satisfied’ to ‘strongly satisfied’ , but also has made most of the educated sector ‘satisfied’ to ‘strongly satisfied’. References Danaher, P.J., Haddrell, V., 1995. A comparison of question scales used for customer satisfaction measurement. Proceedings of World Marketing Congress VII-I, 118–121. Mok, C., Armstrong, R.W., Go, F.M., 1995. Taiwanese travelers’ perception of leisure destination attributes. Australian Journal of Hospitality Management 2 (1), 17–22. Peterson, R.A., Wilson, W.R., 1992. Measuring customer satisfaction: fact and artifact. Journal of the Academy of Marketing Science 20, 61–71 Shih, D., 1986. VALS as a tool of tourism market research: the Pennsylvania experience. Journal of Travel Research 24 (4), 2–11. Stevens, B.F., 1992. Price value perceptions of travelers. Journal of Travel Research 31, 44–48. Yau, O.H.M., Chan, C.F., 1990. Hong Kong as a travel destination in South-East Asia: a multidimensional approach. Tourism Management 11 (2), 123–132. Read More
Cite this document
  • APA
  • MLA
  • CHICAGO
(“Determinants of Customer Satisfaction in the Hotel Industry: the Dissertation”, n.d.)
Retrieved from https://studentshare.org/tourism/1430886-determinants-of-customer-satisfaction-in-the-hotel
(Determinants of Customer Satisfaction in the Hotel Industry: The Dissertation)
https://studentshare.org/tourism/1430886-determinants-of-customer-satisfaction-in-the-hotel.
“Determinants of Customer Satisfaction in the Hotel Industry: The Dissertation”, n.d. https://studentshare.org/tourism/1430886-determinants-of-customer-satisfaction-in-the-hotel.
  • Cited: 0 times

CHECK THESE SAMPLES OF Determinants of Customer Satisfaction in the Hotel Industry

Service Recovery Effects on Customer Satisfaction

To gain insight into this topic, the researcher used questionnaires to collect data which was used to analyze the impact of service delivery on customer loyalty and satisfaction in the hotel industry.... The research 'Service Recovery Effects on Customer Satisfaction' focuses on the impact of service recovery in the hotel industry.... Research Aim This report aims to examine the impacts of service recovery on customer satisfaction and loyalty in the hotel industry....
16 Pages (4000 words) Essay

Logistics and Operations Management

8 Pages (2000 words) Assignment

Customer Loyalty at a Catered House in London

Within the UK, the hospitality industry is highly competitive and service levels are a vital factor in ensuring customer satisfaction with the hospitality services they receive.... But customer satisfaction alone may not be adequate; rather it is customer loyalty that can prove to be cost effective and enable an organisation to gain a competitive advantage in the current global marketplace.... The SERVQUAL method is examined in the context of the catered The findings suggest that price may be the most important determinant of customer loyalty, followed by location....
37 Pages (9250 words) Essay

Hospitality Operations

This makes the hospitality industry, such as the hotel sector, unique in operations.... Being a service industry, the hotel sector, for instance, has a number of challenges that render it unique in comparison to other industries.... The operations of the hospitality industry are subject to a number of distinctive challenges that render it dissimilar to other industries given its service context (Hassanien, Dale and Clarke, 2010, p.... Ensuring an efficient operation of the hospitality industry, unlike other sectors, depends on clear and precise strategies set to tackle such characteristics and their related challenges....
2 Pages (500 words) Coursework

A proposal for conducting a business research

Pricing determinants in the hotel industry: Quantile regression analysis.... Customer loyalty in the hotel industry: the role of customer satisfaction and image.... Global strategies in the international hotel industry.... The satisfaction index of customers in turn becomes a fundamental determinant of the hotel's success and sustainability.... This research combined with the review of existing literatures will form a foundation that will pave way for the researcher through which appropriate pricing strategies can be recommended to the hotel's management board....
3 Pages (750 words) Research Proposal

The Impact of New and Future Technological Development on the Hospitality Industry

The paper studies various researches on changing trends in technology for the hotel industry and their impact on customer experience, profitability and gaining the competitive edge.... the hotel industry is a competitive market in which guests are becoming increasingly selective in their preferences.... Technology has always had a great impact on the hospitality industry.... o Poon(1993), there is no chance of any major player in the tourism industry to be unaffected by information technology'(cited in Khosrow-Pour et al....
9 Pages (2250 words) Research Paper

Hotel Plaza Athne in Paris

The growth in the hotel industry has also been accompanied by the increasing level of competition.... In recent years, the hotel industry has accorded significant growth.... In order to deal with the challenges of increased competition, the hotel industry is required to frame competitive strategies for improving their competitiveness and retaining the customers.... However, formulating competitive strategy has become quite challenging for hoteliers due to the reason that the hotel industry is changing rapidly along with the increase in the level of competition (Tavitiyaman et al....
26 Pages (6500 words) Research Paper

Management of Accommodation for Customer Satisfaction: NiteNite City Hotels, Birmingham

(2002), in the hotel industry, service quality that satisfies the customers is very important in encouraging them to visit again or remain loyal to the hotel.... The key to gaining a sustainable advantage in the hotel business is based on delivering high-quality service that satisfies customers.... in the hotel and hospitality industry, the greatest challenge to managers remains provision and sustenance of customer satisfaction (Barsky and Nash, 2006)....
13 Pages (3250 words) Coursework
sponsored ads
We use cookies to create the best experience for you. Keep on browsing if you are OK with that, or find out how to manage cookies.
Contact Us