StudentShare
Contact Us
Sign In / Sign Up for FREE
Search
Go to advanced search...
Free

Math Portfolio: Logo Reconstruction - Report Example

Cite this document
Summary
Curves have attracted our attention since time immemorial and this is the reason why it finds invaluable place in almost every walk of our life from sculpture and poetry to mathematics and applied sciences. It is therefore, not surprising that brightest of brains in mathematical and physical sciences have devoted their best of the abilities in exploring…
Download full paper File format: .doc, available for editing
GRAB THE BEST PAPER95.4% of users find it useful
Math Portfolio: Logo Reconstruction
Read Text Preview

Extract of sample "Math Portfolio: Logo Reconstruction"

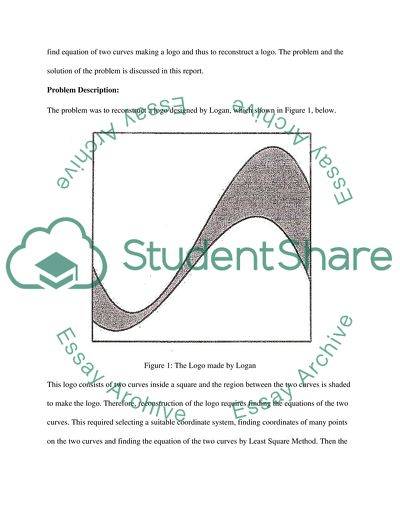
Logo Reconstruction Introduction: Curves have attracted our attention since time immemorial and this is the reason why it finds invaluable place in almost every walk of our life from sculpture and poetry to mathematics and applied sciences. It is therefore, not surprising that brightest of brains in mathematical and physical sciences have devoted their best of the abilities in exploring, appreciating and explaining different kinds of curves. Curves find considerable deliberations in co-ordinate geometry and calculus. In fact it is quite challenging and satisfying exercise for the experts and students of mathematics to find equations of unknown curves by using the principles of coordinate geometry and calculus, taking the advantage of different kind of symmetries and changing slopes of the curve at different points. This approach is an analytical approach. Another approach can be a numerical approach, where one takes and arbitrary coordinate systems and finds the coordinates of many points on the curve, then he makes an intelligent guess about the equation of the curve and optimizes the values of the coefficients by using ‘least Square Method” to minimize the errors. This may be a very laborious exercise. However, the labor may be reduced considerably by intelligent choice of the coordinate system and the guessed equation of the curve. Now a days availability of fast computers and appropriate software have greatly reduced the time and effort involved in numerical approach for finding the equation of an unknown curve. One such software is MS Office Excel. In this software one just needs to feed the values of the x-y coordinates, draw a scatter plot and fit different curves and see which curve is the best fit. In this exercise, numerical approach has been adopted using MS Office Excel to find equation of two curves making a logo and thus to reconstruct a logo. The problem and the solution of the problem is discussed in this report. Problem Description: The problem was to reconstruct a logo designed by Logan, which shown in Figure 1, below. Figure 1: The Logo made by Logan This logo consists of two curves inside a square and the region between the two curves is shaded to make the logo. Therefore, reconstruction of the logo requires finding the equations of the two curves. This required selecting a suitable coordinate system, finding coordinates of many points on the two curves and finding the equation of the two curves by Least Square Method. Then the problem was to reshape the Logo to fit onto a T-shirt and on a business card. The strategy adopted and the actual solution is discussed in the subsequent sections. Strategy to Solve the Problem: The first part of the strategy was to select a suitable coordinate system so that subsequent processing becomes easier. For this the curves were examined closely and it was observed that there is some sort of symmetry is the origin and axes were chosen properly. For the upper curve it can be seen that if the ‘x’ any ‘y’ axes are chosen along the sides of the curve with the origin being between the maxima and the minima then replacing ‘x’ by ‘-x’, causes ‘y’ to change to ‘-y’. Therefore, the origin was kept between the maxima and minima of the upper curve and the ‘x’ and ‘y’ axes were kept parallel to the sides of the square. Besides, it was seen that the upper curve will then pass through the origin. As the upper curve has two extreme points (one maxima and one minima), therefore it has to be a cubic polynomial. It was also observed that the lower curve is very much like the upper curve; however, the lower curve was slightly shifted with respect to the upper curve. Solving the Problem: The ‘x’ and ‘y’ axes were kept parallel to the sides of the square and the origin was taken between the maxima and minima of the upper curve. Then value of ‘x’ coordinate was taken chosen from -35 mm to +30 mm at an increment of 5 mm; with respect to this coordinate system and the corresponding values of ‘y’ coordinate was then measured for both the curves. Thus the coordinates of 14 points were measured and recorded on an MS Office Excel Spreadsheet for both the curves. Coordinates of so many points were measured to ensure that a smooth curve could be reconstructed which is as close as possible to the curves in the Logo shown in Figure 1. The measurements were made using a scale with a least count of 1 mm and therefore all the measurements are up to one decimal point. The measured values are presented in Table 1 (on the next page). Table 1: Coordinates of the Different Points on the Two Curves Making the Logo x (mm) y (mm) (Upper Curve) y (mm) (Lower Curve) -35 -11 -28.5 -30 -21 -31.5 -25 -25.5 -31.5 -20 -25 -29 -15 -22 -24.5 -10 -16 -19 -5 -8 -13.5 0 0 -7 5 8 -2 10 16 2 15 22 4 20 25 4 25 25.5 0.5 30 21 -8 Subsequently scatter plot for the two curves, was made from the measured coordinates of the 14 points on the two curves. Because, there are two extreme points (one maxima and one minima) on both the curves, therefore, this curve should be a cubic polynomial. Therefore, a cubic polynomial trend line was fitted onto the scatter plot. The scatter plot along with the cubic trend line is shown in Figure 2: below. One can seen that the trend line is fitting nicely into the measured coordinates of the curve. This means the equation of the curve that has been generated is extremely accurate and as good as that in the Logo designed by Logan. This is confirmed by extremely high value of the coefficient of determination R2. The coefficient of determination R2, gives the fraction of the values of the dependent variable (here y) which can be explained by the trend line equation. Its maximum value can be 1 for perfect fitting and 0 for worst fitting. In this case the value of R2 is 0.9998 and 0.9996 for the upper and the lower curve respectively. This means that the cubic polynomial trend line is nearly perfect fit through the measured coordinates of the curves making the Logo. Hence the equation of the curves is Upper Curve: y = -0.0011x3 + 0.0001x2 + 1.716x Lower Curve: y = -0.0008x3 – 0.0138x2 + 1.1522x – 7.1424 The curves are modeled by a cubic polynomial. This is because there are two extreme point - one maxima and one minima and therefore, the curve has to be a cubic polynomial and only a cubic polynomial can give one two extreme point. Why it should not be modeled using a Sin Function One may be tempted to model the curves using a Sin or a Cosine function as it shows a maximum and a minimum and has a shape like a portion of a Sin / Cosine curve, in the domain under consideration. If one decides to go for a Sin function, then all that is needed is to take a suitable origin (Between the maxima and minima) and scale the ‘x’ and ‘y’values corresponding to maxima with /2 and 1 respectively. This will give the equation for the two curves. However, the origin and ‘x’ axes for the two curves will then are different. One can then try to accommodate the shift of origin and axes by incorporating suitable phase difference between the two curves. However, there is a serious problem. While the scale is the same on the x-axis - 22.5 mm for /2 ; for both the curves; it is different on the y-axis. For upper curve - 26.5 mm is equivalent to 1 while for Lower curve - 18.5 mm is equivalent to 1. This makes it very difficult to model the two curves as Sin curve on the same set of axes.. There is another very fundamental difficulty in modeling the two curves as a Sin function. Third order polynomial will cut x-axis at three points, which looks very obvious from the shape of the curve. But a Sin curve will cut x-axis at infinite number of points, which is something not explicit from the curve and is as good as stretching the imagination too much. These are the reasons why Sine / Cosine functions should not be used to model the curves making the Logo and this is why I preferred a cubic polynomial in stead of a Sine or a Cosine function. For printing the Logo on a T-shirt, the logo needs to be doubled in size. To do this the function needs to be modified. For this modification y should be replaced by ‘2y’ and ‘x’ should be replaced by ‘2x’ in the equation of the upper and the lower curve. For printing the Logo on a business card of 9 cm by 5 cm size following modification should be done in the equation of the upper and lower curves. While y should be kept unchanged, ‘x’ should be replaced by (9/5)x. This alteration will serve the purpose. T-shirt, the logo needs to be doubled in size. To do this the function needs to be modified. For this modification y should be replaced by ‘2y’ and ‘x’ should be replaced by ‘2x’ in the equation of the upper and the lower curve. The modified equation for printing the logo on a standard business card of 9 cm x 5 cm will be Upper Curve: y = -0.0064512x3 + 0.000324x2 + 3.0888x Lower Curve: y = -0.0046656x3 – 0.044712x2 + 2.07396x – 7.1424 The area of the Logo will be ALogo = = 113.3975376 mm2 Area of the standard business card ACard = 50 * 90 mm2 = 4500 mm2 Therefore, the area fraction of the Logo on the business card will be ALogo / ACard = 113.3975 / 4500 = 0.025 This means ~ 2.5% of the area on the Business card will be covered by the Logo. This is important, because if the Logo covers large area then there will be less space available to write other things on the Business card. Conclusions: It can be concluded that a curve can be reconstructed using numerical methods by selecting suitable coordinate axes and then fitting a suitable curve through the measured coordinates of the points on the curve. This has many real life applications like printing a logo on a T-shirt and on a business card to name a few, that has been discussed in this report. Read More

Strategy to Solve the Problem: The first part of the strategy was to select a suitable coordinate system so that subsequent processing becomes easier. For this the curves were examined closely and it was observed that there is some sort of symmetry is the origin and axes were chosen properly. For the upper curve it can be seen that if the ‘x’ any ‘y’ axes are chosen along the sides of the curve with the origin being between the maxima and the minima then replacing ‘x’ by ‘-x’, causes ‘y’ to change to ‘-y’.

Therefore, the origin was kept between the maxima and minima of the upper curve and the ‘x’ and ‘y’ axes were kept parallel to the sides of the square. Besides, it was seen that the upper curve will then pass through the origin. As the upper curve has two extreme points (one maxima and one minima), therefore it has to be a cubic polynomial. It was also observed that the lower curve is very much like the upper curve; however, the lower curve was slightly shifted with respect to the upper curve.

Solving the Problem: The ‘x’ and ‘y’ axes were kept parallel to the sides of the square and the origin was taken between the maxima and minima of the upper curve. Then value of ‘x’ coordinate was taken chosen from -35 mm to +30 mm at an increment of 5 mm; with respect to this coordinate system and the corresponding values of ‘y’ coordinate was then measured for both the curves. Thus the coordinates of 14 points were measured and recorded on an MS Office Excel Spreadsheet for both the curves.

Coordinates of so many points were measured to ensure that a smooth curve could be reconstructed which is as close as possible to the curves in the Logo shown in Figure 1. The measurements were made using a scale with a least count of 1 mm and therefore all the measurements are up to one decimal point. The measured values are presented in Table 1 (on the next page). Table 1: Coordinates of the Different Points on the Two Curves Making the Logo x (mm) y (mm) (Upper Curve) y (mm) (Lower Curve) -35 -11 -28.

5 -30 -21 -31.5 -25 -25.5 -31.5 -20 -25 -29 -15 -22 -24.5 -10 -16 -19 -5 -8 -13.5 0 0 -7 5 8 -2 10 16 2 15 22 4 20 25 4 25 25.5 0.5 30 21 -8 Subsequently scatter plot for the two curves, was made from the measured coordinates of the 14 points on the two curves. Because, there are two extreme points (one maxima and one minima) on both the curves, therefore, this curve should be a cubic polynomial. Therefore, a cubic polynomial trend line was fitted onto the scatter plot. The scatter plot along with the cubic trend line is shown in Figure 2: below.

One can seen that the trend line is fitting nicely into the measured coordinates of the curve. This means the equation of the curve that has been generated is extremely accurate and as good as that in the Logo designed by Logan. This is confirmed by extremely high value of the coefficient of determination R2. The coefficient of determination R2, gives the fraction of the values of the dependent variable (here y) which can be explained by the trend line equation. Its maximum value can be 1 for perfect fitting and 0 for worst fitting.

In this case the value of R2 is 0.9998 and 0.9996 for the upper and the lower curve respectively. This means that the cubic polynomial trend line is nearly perfect fit through the measured coordinates of the curves making the Logo. Hence the equation of the curves is Upper Curve: y = -0.0011x3 + 0.0001x2 + 1.716x Lower Curve: y = -0.0008x3 – 0.0138x2 + 1.1522x – 7.1424 The curves are modeled by a cubic polynomial. This is because there are two extreme point - one maxima and one minima and therefore, the curve has to be a cubic polynomial and only a cubic polynomial can give one two extreme point.

Why it should not be modeled using a Sin Function One may be tempted to model the curves using a Sin or a Cosine function as it shows a maximum and a minimum and has a shape like a portion of a Sin / Cosine curve, in the domain under consideration.

Read More
Cite this document
  • APA
  • MLA
  • CHICAGO
(Math Portfolio: Logo Reconstruction Report Example | Topics and Well Written Essays - 1750 words, n.d.)
Math Portfolio: Logo Reconstruction Report Example | Topics and Well Written Essays - 1750 words. https://studentshare.org/design-technology/1724913-math-portfolio-question
(Math Portfolio: Logo Reconstruction Report Example | Topics and Well Written Essays - 1750 Words)
Math Portfolio: Logo Reconstruction Report Example | Topics and Well Written Essays - 1750 Words. https://studentshare.org/design-technology/1724913-math-portfolio-question.
“Math Portfolio: Logo Reconstruction Report Example | Topics and Well Written Essays - 1750 Words”. https://studentshare.org/design-technology/1724913-math-portfolio-question.
  • Cited: 0 times

CHECK THESE SAMPLES OF Math Portfolio: Logo Reconstruction

Information systems in construction ''Proliance''

This paper relates the concept of Infrastructure Lifecycle Management (ILM), aimed towards the proper planning, construction and maintenance of any construction project, and its implementation in modern information systems.... It elaborates the various features of the Proliance software platform – an ILM system developed by Meridian Systems Inc....
21 Pages (5250 words) Term Paper

Analysis, design, implementation and testing of a web developing company

hellip; The purpose of this research paper will be to analyse the web market in Oxford; create a list with the retailers with no websites or with bad websites; design the project website using the required methods and skills; create a wider range of portfolio product/service; have a unique web developing company for the Small/Medium local businesses.... Also, the website company will provide different offers from the product portfolio.... Design the project website using the required methods and skills Create a wider range of portfolio product/service Have a unique web developing company for the Small/Medium local businesses 1....
37 Pages (9250 words) Dissertation

Communication Learning Portfolio

The following is the resume that was used:Address 1 Telephone/Message:Address 2 SUMMARY Multimedia / Graphic Arts / 3D Accident reconstruction Specialist Strengths:Outstanding ability to integrate business and digital design environments seamlessly:MBA in Business and FinanceProfessional Studies in...
15 Pages (3750 words) Essay

Cosmetic Surgery - New Form of Modern Art or Pure Science

The researcher of this essay aims to analyze the cosmetic surgery.... The main question of this paper is "Cosmetic surgery: a new form of art, pure science or combination of both?... .... The issue of cosmetic surgery is probably the most debated within the domain of modern medicine.... … The paper gives a reply on the question: Is modern cosmetic surgery a state of art of a sophisticated scientific branch?...
39 Pages (9750 words) Essay

Management Portfolio

In addition to the above determinants, there is strong need for designing an effective document control process to ensure accuracy and compliance on the management portfolio with relevant data management processes.... The entire portfolio is presented with effective case studies, schematic diagrams and data tables for better understanding and application....
16 Pages (4000 words) Essay

Affordances of an Educational Technology Tool (Blogs)

As the paper stresses Bogging as an ICT tool in the math classroom and other academic contexts, for that matter, has benefits as “a method of public discourse of the information society”.... 'Collaborative constructions of knowledge' are the learning outcomes of deductive/inductive logic, blogging of math theories, blogging on cognitive perspectives.... ICT, with use of blogging techniques, “focuses on collaboration through the computer or computer-supported collaborative learning (CSCL), assisted by different network-based collaborative tools, within the math classrooms”....
4 Pages (1000 words) Essay

PepsiCo Inc. Case Study

With sizable investment portfolio and relatively strong brand, Pepsi can shake beverage market remarkably.... This paper discusses Pepsi that is one of the leading beverage brands globally with operations in nearly 200 hundred countries.... Pepsi specializes in food and beverage with equitable brand portfolios such as Frito-Lay, Pepsi-Cola, Tropicana, and Quaker....
5 Pages (1250 words) Essay

Alternative Investments: Risk and Returns

hellip; The author states that an unleveraged investment portfolio, of course, cannot loose more than its original amount of capital.... The importance and key role hedge funds play by using leverage, short selling, and other derivatives strategies could have an influencing effect on portfolio management by providing downside protection....
26 Pages (6500 words) Dissertation
sponsored ads
We use cookies to create the best experience for you. Keep on browsing if you are OK with that, or find out how to manage cookies.
Contact Us