StudentShare
Contact Us
Sign In / Sign Up for FREE
Search
Go to advanced search...
Free

Calculation of Accounting Profit and Financial Profit - Assignment Example

Cite this document
Summary
This assignment "Calculation of Accounting Profit and Financial Profit" presents incremental Cash Flows. This implies that a project should be undertaken only if there is an expectation that the project would add to the monetary value of the firm and would be positive…
Download full paper File format: .doc, available for editing
GRAB THE BEST PAPER91.5% of users find it useful
Calculation of Accounting Profit and Financial Profit
Read Text Preview

Extract of sample "Calculation of Accounting Profit and Financial Profit"

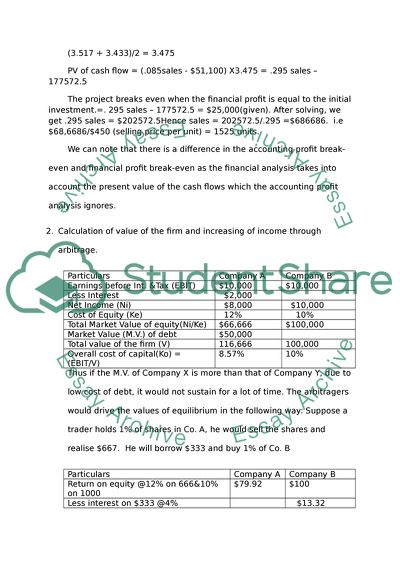
1. Calculation of Accounting Profit and Financial Profit: Particulars $ % Selling Price per unit 450 100 Variable Cost per unit 375 83.33 Contribution per unit 75 16.67 Formula of Accounting Profit break even analysis = (Fixed Cost + Depreciation on the machinery)/Contribution per unit Depn. = Machinery cost / life of the machinery = $25,000(given)/5 years = $5,000 Hence B.E.P. according to accounting profit is (105,000+$5,000)/$75= 1467 units. 1467 units of wheel barrows should be sold to achieve accounting Breakeven. Calculation of Financial Profit: Contribution in % terms = 16.67 Fixed cost + Depreciation = 110,000$ Pre-tax profit = (.1667X Sales) - $110,000 Tax@ 49% = .49(.1667sales - $110,000) Profit after tax = .51(.1667sales - $110,000) Cash flow = PAT + Depn. = (.085sales - $56,100) + 5,000 = .085 sales – $51,100 Since the cash flow is for 5 years, its present value at a discount rate of 13.5% (given) = (.085 sales - $51,100) X PVIFA (5 years, 13.5%) For arriving at 13.5% PVIFA table, we have to find the average of 13% and 14% = (3.517 + 3.433)/2 = 3.475 PV of cash flow = (.085sales - $51,100) X3.475 = .295 sales – 177572.5 The project breaks even when the financial profit is equal to the initial investment.=. 295 sales – 177572.5 = $25,000(given). After solving, we get .295 sales = $202572.5Hence sales = 202572.5/.295 =$686686. i.e $68,6686/$450 (selling price per unit) = 1525 units. We can note that there is a difference in the accounting profit break-even and financial profit break-even as the financial analysis takes into account the present value of the cash flows which the accounting profit analysis ignores. 2. Calculation of value of the firm and increasing of income through arbitrage. Particulars Company A Company B Earnings before Int. &Tax (EBIT) $10,000 $10,000 Less Interest $2,000 Net Income (Ni) $8,000 $10,000 Cost of Equity (Ke) 12% 10% Total Market Value of equity(Ni/Ke) $66,666 $100,000 Market Value (M.V.) of debt $50,000 Total value of the firm (V) 116,666 100,000 Overall cost of capital(Ko) = (EBIT/V) 8.57% 10% Thus if the M.V. of Company X is more than that of Company Y, due to low cost of debt, it would not sustain for a lot of time. The arbitragers would drive the values of equilibrium in the following way: Suppose a trader holds 1% of shares in Co. A, he would sell the shares and realise $667. He will borrow $333 and buy 1% of Co. B Particulars Company A Company B Return on equity @12% on 666&10% on 1000 $79.92 $100 Less interest on $333 @4% $13.32 Net return $79.92 $86.68 Thus traders returns are expected to increase by $ 6.76 in company B and the investors would like to arbitrage to increase their wealth. (Miller and Modigilani)…..1 3. Calculation of M.V. of share, firm and WACC. Particulars Before repurchase of equity($) After repurchase of equity($) EBIT less interest $180,000 -0 = 180,000 $180,000- $13,500= 166,500 Tax @ 30% 54,000 49,950 Net Income (Ni) 126,000 116,550 Cost of equity (Ke) 14% 14% Market value of equity(Ni/ke) 900,000 832,500 Market value of debt 150,000 Total market value of firm 900,000 982,500 Ke 14% 14% Kd 9% Market value of equity Ni/ke = ROI Ni/Ke = ROI 126,000/M.V. = 14% (given) 116,550/M.V. = 14%(given) a. M.V. of Virginia share = M.V. of the firm / No. of shares = 900,000/50,000 = $18/share. b. Market value of the restructured firm = $982,500 (derived) c. Cost of equity (Ke) = 14%, Cost of debt (Kd) = 9%(1-30%(tax))= 6.3% Assignment of Weights: Debt = 150,000/982,500 = 15%: Equity = 832500/982500=85% Instrument Amount Weights Specific Costs Total Cost Debt 150,000 0.15 6.3 .945 Equity 832500 0.85 14 11.9 Total 982500 1 12.845 4. Company Cost Vs. Project Cost of Capital Company Cost Project Cost Rate of return which the share holders of the company expect. Rate of return which the capital providers expect It is also known as the Weighted Average cost of capital and is dependent on the financing mix of the company. It is dependent on the risk factors and capacity of debt of the project. It is the standard on which the decisions of project evaluation are done. It may be a standard for the future project appraisals. Thus, we can differentiate between the company cost and project cost of capital. 5. Calculation of Weighted Average Cost of Capital Cost of a debt = Kd =( I(1-t) +(RV-SV)/n)/(RV+SV)/2 where I = Interest rate =8%, t=Tax = 30% RV = Realisable value = $104, SV = Sale value less issue costs = $100-13% of $104 = $86.48 N = 16 years. Hence Kd = (8 (1-.3) + ($104-$86.48)/16)/($104+$86.48)/2 = 7.03% …..(1) Cost of Equity = Ke = (D/NpX100)+G, where D = Dividend paid = $.325, Np = Net Proceeds =$3-$.125=$2.875, G = growth rate= 6%. Hence Ke=(.325/2.875X100)+6=11.30+6= 17.30%(2) Cost of irredeemable pref. shares = Kp = Dp/NpX100, where Dp=Dividend paid = $.15, Np = Net Proceeds = $5-$.25 =$4.75, Kp= (15/4.75)X100 = 3.15 ……..(3) Cost of retained earnings = Kr = Ke(1-t), where Ke = 17.30 (derived), t = tax = 30% Kr = (17.30 (1-.3)) = 17.30X0.7 = 12.11% ……..(4) The preference share capital at par is $50000*$5 = $250000 which comprises 15% of the weight. Hence retained earnings of $250000 is also equal to 15%. Weighted Average cost of capital : Source Proportion After Tax Cost WACC Bonds .38 7.03 2.67 Preference Shares .15 3.15 0.47 Equity Share Capital .32 17.30 5.54 Retained Earnings .15 12.11 1.82 Total WACC 1.0 10.5% Case Study: Answer to Question No.2: Working Notes: Initial Investment: $500,000+$60,000+$20,000+$40,000= 6,20,000 Cost of the Machinery: 600000 Opportunity cost: 12000 Depreciation: Year Depn. Allowance Depn. Expense Book Value 0n $600,000 1 33% 1,98,000 4,02,000 2 45% 2,70,000 1,32,000 3 15% 90,000 42,000 4 7% 42,000 0 Volume of Sales: 200000 Cash Flows: Year 1 Year 2 Year 3 Year 4 Salvage Value Sales 8,00,000 8,00,000 8,00,000 8,00,000 50,000 (given) Less: Variable and Fixed Cost (200,000@$3 per bottle:) 6,00,000 6,00,000 6,00,000 6,00,000 0 Less: Opportunity Cost 12,000 12,000 12,000 12,000 _______________________________________________________ Cash Flows before 1,88,000 1,88,000 1,88,000 1,88,000 50,000 Depn. And Tax. (CFBT) _______________________________________________________ Calculation of Total Cash Flows (TCF) PVIF % Year CFBT - Depn. = N.P. - Tax - 40% PAT + Depn. = TCF 10 1 1,88,000 1,98,000 -10,000 0 -10,000 1,98,000 1,88,000 0.909 2 1,88,000 2,70,000 -82,000 0 -82,000 2,70,000 1,88,000 0.826 3 1,88,000 90,000 98,000 39,200 58,800 90,000 1,48,800 0.751 4 1,88,000 42,000 1,46,000 58,400 87,600 42,000 1,29,600 0.683 4 50,000 50,000 TCF at 10% NPV is equal to TCF at 10% less Initial Investment -59,404 170892 155288 111749 88517 34150 SUM 560596 Since the NPV is negative, the project need not be considered. Calculation of IRR: Using PVIF tables Year Data Description 6 TCF at 6% 5 TCF at 5% 0 -6,20,000 Initial Investment 1 -6,20,000 1 -620000 1 1,88,000 Return from the first year 0.943 177284 0.952 178976 2 1,88,000 Return from the first year m the second year 0.89 167320 0.907 170516 3 1,48,800 Return from the third year 0.84 124992 0.864 128563 4 1,77,600 Return+Salvage in 4th Year 0.792 140659.2 0.823 146165 -9,745 4220 Hence the IRR would be between 6% and 5%. To find out the correct rate of return, the formula is: 5% and 0.302188 is equal to 5.30%. Calculation of MIRR: FVIF % Year Data Description 10 TCF at 10% 0 -620000 Initial Investment 0 1 1,88,000 Return from the first year 1.464 275232 2 1,88,000 Return from the first year m the second year 1.331 250228 3 1,48,800 Return from the third year 1.21 180048 4 1,77,600 Return + salvage in the fourth year. 1.1 195360 900868 If we equate Initial Investment and TCF at 10% 6,20,000 is equal to 900868/4th root of (1+MIRR). (1+MIRR) to the power of 4 = 1.453013 By Solving the equation, we get MIRR = 4.10% Calculation of Pay Back period: Year CFAT Cum.CFAT 1 1,88,000 1,88,000 2 1,88,000 3,76,000 3 1,48,800 5,24,800 Base Year 4 1,77,600 7,02,400 Next Year Hence the initial investment would be paid back only in the fourth year. By the formula: Base year + Required CFAT/Next Year CFAT, we can find the exact period of pay back. 3 years 0.536036 3years 6 months is the required payback period which is very high. The investment should not be taken up as the NPV is negative, IRR is not to the standards expected, so also the MIRR and the Payback period suggests a long gestation period. Question No. 5 in the case study: Initial Investment 620000 PVIF values for specific % 5% increase in sales: 4.20/unit 2% increase in the operating costs 3.06/unit 10 0.909 11 0.901 Contribution per unit 1.14/unit 0.826 0.812 0.751 0.731 Net profit for 200000 units 228000 0.683 0.659 less opportunity cost 12000 Cash Flows Before Tax (CFBT) 216000 Year CFBT Less Depn. N.P. Less Tax PAT ADD Depn. CFT 1 216000 198000 18000 7200 10800 198000 208800 2 216000 270000 -54000 0 -54000 270000 216000 3 216000 90000 126000 50400 75600 90000 165600 4 216000 42000 174000 69600 104400 42000 146400 50000 786800 CFT at 10% amounts to Year 1 Year 2 Year 3 Year 4 Total CFT 189799 172469 124366 99991 34150 620775 CFt at 11% amounts to Year 1 Year 2 Year 3 Year 4 Total CFT 188129 175392 121054 96478 32950 614003 IRR would be between 10% and 11% which could be calculated as follows: 10.89 NPV is also positive at 10% as follows: 775 Hence the project can be considered. 6. Ans. Initial Investment for both the projects is 200000 Project A: Project B: PVIFA% PVIFA % Cash Flow 10 CF at 10% NPV Cash Flow 10 CF at 10% NPV 120000 1.736 208320 8320 67,000 3.17 212390 12390 The Project B has greater NPV and theoretically it should be chosen. But as it does not consider inflation, decision has to be made only after carefully keeping those factors also in mind. 7.Ans. Initial saleable value Truck 1 20000 Truck 2 PVIF % PVIF % Year Cash Flow 10 CF at 10% Year Cash Flow 10 CF at 10% 1 8400 0.909 7636 0 20000 1 20000 2 8000 0.826 6608 1 12400 0.909 11272 3 7000 0.751 5257 2 8000 0.826 6608 19501 37880 NPV : -499 The truck should be sold off immediately. The truck can be sold after 2 years. 8 Ans. Initial Investment 620000 Quantity of sales 200000 Selling price per unit 4.2 Operating costs per unit 3.15 Contribution per unit 1.05 contribution in $ 210000 Less Opportunity Cost 8000 202000 Tax rate 40% PVIF % CFBT Less Depn. N.P Less Tax PAT Add Depn. CFT 10 TCF at 10% 202000 198000 4000 1600 2400 198000 200400 0.909 182164 202000 270000 -68000 0 -68000 270000 202000 0.826 166852 202000 90000 112000 44800 67200 90000 157200 0.751 118057 202000 42000 160000 64000 96000 42000 138000 0.683 94254 561327 NPV would be -58673 The project should not be considered. b. Suppose the selling price only increases by 2% and the operating costs increase by 5 %, then naturally, the NPV would be even more negative and as such, the project should not be undertaken. c. At 0 year, the Break even price for the project could be determined as under: Number of units for sale: 200000 Operating costs per unit $3 Operating costs per 200000 units 600000 Opportunity Cost 12000 Total Amount required for break - even 612000 The selling price should be fixed at 3.06 d. Selling price per unit 4 Operating cost per unit 3.06 contribution per unit 0.94 The opportunity cost have to be covered by the contribution per unit to break even. Hence Break even point in sale able units is 12765.96 Hence 12,766 units have to be sold to break even. Answers to Question No.s 1,3 & 4 in the case study: Question No. 1: Incremental Cash Flows: “A project should be measured in incremental terms”(Prasanna Chandra, 2004). This implies that a project should be undertaken only if there is an expectation that the project would add to the monetary value of the firm and would be positive. As such, analysis should be done about the firm’s profitability with and even without the project. All Incidental Effects which strategically contribute to the improvement in the general performance of the firm should be considered. All opportunity costs which the firm is supposed to forego if it undertakes any project should be calculated and subtracted from the expected cash flows of the project. However, sunk costs like the $200,000 which Archer had already spent to rehabilitate that section of the main plant are to be ignored while considering the cash flows. Suppose another wine maker would accept a lease offer for $10,000, that represents opportunity cost and should be deducted from the 4 years estimated cash flows and then NPV should be arrived at. Answer to Question 3: If the project would have involved a replacement instead of expansion, the following things have to be considered: a. The fixed cash operating expenses need not be considered for the Break-even. b. The immediate effect on the sales of the other products should be considered as an opportunity cost. c. If the earlier machinery would be put to use, then, the value of the machinery and its depreciation have to put into the cash flows instead of the present one. Answer to Question 4: The inflation rate of 5% though has been factored in the 10% cost of capital, it only represents the expectations in respect to the project. The inflation with respect to the sale price, the escalation in the operating costs etc., have not been factored while constructing the NPV and as such, taking decisions only if the NPV is positive would be a biased decision. Even if NPV were positive, care should be taken to consider the incidental effects, the inflation rate and also the life time of the project. For example: If a project for 3 years gives a slightly lower NPV than that of a project for 5 Years, it is better to consider the 3 year project as it is giving promising returns within a shorter span of time. Thus, along with NPV and IRR, strategic decisions have to be taken for the company keeping in view other factors failing which, the decision making would be defective and the firm may incur losses in the long run. References: Prasanna Chandra, 2004, Financial Management – Theory and Practice, Tata Mc-Graw hill publishers, Chapters -Techniques of Capital Budgeting, The Cost of Capital & Pgs. 581-585, 348-350, 320-321. Dr.K. Ramakrishna Sarma, Financial and Investment Management, Osmania University – M.Com (Previous text book), Chapters – Theories of Capital Structure, Capital Budgeting – Discounted Cash Flows Method. Read More
Cite this document
  • APA
  • MLA
  • CHICAGO
(Calculation of Accounting Profit and Financial Profit Assignment Example | Topics and Well Written Essays - 2250 words, n.d.)
Calculation of Accounting Profit and Financial Profit Assignment Example | Topics and Well Written Essays - 2250 words. https://studentshare.org/finance-accounting/1712416-corporate-finance
(Calculation of Accounting Profit and Financial Profit Assignment Example | Topics and Well Written Essays - 2250 Words)
Calculation of Accounting Profit and Financial Profit Assignment Example | Topics and Well Written Essays - 2250 Words. https://studentshare.org/finance-accounting/1712416-corporate-finance.
“Calculation of Accounting Profit and Financial Profit Assignment Example | Topics and Well Written Essays - 2250 Words”. https://studentshare.org/finance-accounting/1712416-corporate-finance.
  • Cited: 0 times
sponsored ads
We use cookies to create the best experience for you. Keep on browsing if you are OK with that, or find out how to manage cookies.
Contact Us