StudentShare
Contact Us
Sign In / Sign Up for FREE
Search
Go to advanced search...
Free

Capital Structure and Corporate Financing Decisions - Assignment Example

Cite this document
Summary
The most ordinary tools to make evaluations on financial grounds include the use of financial statements as the core source. The financial statements are…
Download full paper File format: .doc, available for editing
GRAB THE BEST PAPER96.8% of users find it useful
Capital Structure and Corporate Financing Decisions
Read Text Preview

Extract of sample "Capital Structure and Corporate Financing Decisions"

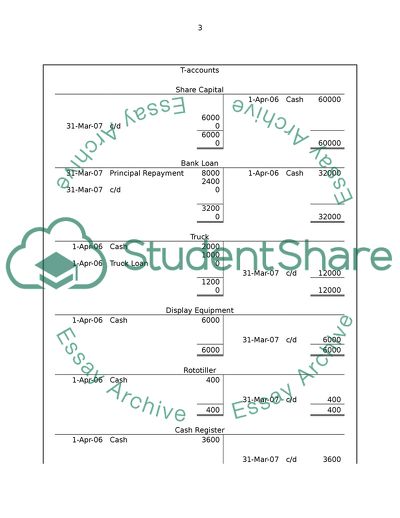
The Garden Place Case Study By: Financial Management Department: 4th May Table of Contents Part1---------------------------------------------------------------------------------------------------- 3 T-accounts………………………………………………………………………………….. 3 Projected Income Statement……………………………………………………………….. 6 Projected Balance Sheet……………………………………………………………………. 6 Part 2---------------------------------------------------------------------------------------------------- 7 Introduction………………………………………………………………………………… 7 Vertical Analysis…………………………………………………………………………… 7 Balance Sheet Analysis……………………………………………………………………. 8 Income Statement Analysis………………………………………………………………… 9 Cash Flow Analysis………………………………………………………………………... 9 DuPont Analysis…………………………………………………………………………… 10 Horizontal Analysis………………………………………………………………………... 10 Conclusion…………………………………………………………………………………. 11 Exhibit……………………………………………………………………………………… 12 References………………………………………………………………………………….. 23   T-accounts         Share Capital       1-Apr-06 Cash 60000           31-Mar-07 c/d 60000     60000 60000         Bank Loan     31-Mar-07 Principal Repayment 8000 1-Apr-06 Cash 32000     31-Mar-07 c/d 24000           32000 32000         Truck     1-Apr-06 Cash 2000     1-Apr-06 Truck Loan 10000       31-Mar-07 c/d 12000     12000 12000         Display Equipment     1-Apr-06 Cash 6000             31-Mar-07 c/d 6000     6000 6000         Rototiller     1-Apr-06 Cash 400             31-Mar-07 c/d 400     400 400         Cash Register     1-Apr-06 Cash 3600             31-Mar-07 c/d 3600     3600 3600                     Inventory     1-Apr-06 Cash 60000 31-Mar-07 COGS 240000     31-Mar-07 Cash 200000 31-Mar-07 20000           260000 260000         Accounts Receivable     31-Mar-07 Sales 60000             31-Mar-07 c/d 60000     60000 60000         Sales       31-Mar-07 Cash 340000     31-Mar-07 Income summary 400000 31-Mar-07 Accounts Receivable 60000           400000 400000         Advertising Expenses     31-Mar-07 Cash 20000       31-Mar-07 Income summary 20000           20000 20000         Rent     31-Mar-07 Cash 7200             31-Mar-07 Income summary 7200     7200 7200         Telephone     31-Mar-07 Cash 1200             31-Mar-07 Income summary 1200     1200 1200                     Utilities     31-Mar-07 Cash 4800       31-Mar-07 Income summary 4800     4800 4800         Payroll     31-Mar-07 Cash 112000       31-Mar-07 Income summary 112000     112000 112000         Interest - Bank Loan     31-Mar-07 Cash 4160       31-Mar-07 Income summary 4160     4160 4160         Truck Loan     31-Mar-07 Principal Repayment 3332 1-Apr-06 Truck 10000     31-Mar-07 c/d 6668           10000 10000         Cash     1-Apr-06 Share Capital 60000 1-Apr-06 Truck 2000     1-Apr-06 Bank Loan 32000 1-Apr-06 Display Equipment 6000     31-Mar-07 Sales 340000 1-Apr-06 Rototiller 400       1-Apr-06 Cash register 3600       1-Apr-06 Purchases 60000       31-Mar-07 Purchases 200000       31-Mar-07 Advertising 20000       31-Mar-07 Rent 7200       31-Mar-07 Utilities 1200       31-Mar-07 Telephone 4800       31-Mar-07 Payroll 112000       31-Mar-07 Interest-Bank Loan 4160       31-Mar-07 Principal Repayment 8000       31-Mar-07 Interest – Truck 700       31-Mar-07 Truck Repayment 3332     31-Mar-07 c/d 1392     433392 433392                   Projected Income Statement           Sales 400,000   Cost of Goods Sold 240,000   Gross Profit 160,000   Other Expenses   Advertisement 20,000   Rent 7,200   Utilities 1,200   Telephone 4,800   Payroll 112,000   Interest - Bank loan 4,160   Interest - Truck 700   Total Expenses 150,060   Net Income 9,940           Projected Balance Sheet         Assets   Inventory 20,000   Accounts Receivable 60,000   Display Equipment 6,000   Rototiller 400   Cash Register 3,600   Truck 12,000   Total Assets 102,000   Liabilities and Equity   Bank Loan 24,000   Truck Loan 6,668   Bank Overdraft 1,392   Total Liabilities 32,060   Share Capital 60,000   Net Profit 9,940   Total Equity 69,940   Total Liabilities & Equity 102,000         Introduction Evaluation of dissimilar corporations, industries or even the entire sectors can be undertaken by using various tools. The most ordinary tools to make evaluations on financial grounds include the use of financial statements as the core source. The financial statements are analyzed on various different bases, which therefore present a comprehensive framework in assessing the results and performances of such corporations. In order to conduct the analysis of the financial statements, normally relative (percentage terms) tools are applied so that the companies in question can be compared with each other. The main frameworks available for financial statement analysis comprise of the conventional ratio analysis technique, vertical analysis, horizontal analysis, and lastly DuPont analysis. All of the above mentioned frameworks have their own effectiveness. However, this particular analysis is conducted with the help of vertical analysis which has been undertaken for two companies namely as Company A and Company B, horizontal analysis has been conducted only in terms of Company A only and lastly, DuPont analysis for both the companies to judge their profitability in respect of 2011 . Vertical Analysis In order to conduct vertical analysis the complete set of financial statements for Company A and Company B, have been utilized such that Balance Sheet, Income Statements and Cash Flow Statements are taken into consideration. The evaluation has been undertaken with a view that the performances of both the companies for the year 2011 in relation to different areas are compared with that of 2010. The discussion below emphasizes the thorough vertical analysis in relation to all three parts of the financial statements. Balance Sheet Analysis The key ingredients of balance sheet are highlighted in this particular analysis such that the performances of both of the companies in respect of current assets, total assets, current liabilities and total equity have been evaluated. The current assets of Company A have remained outstanding with the addition of around 39.39% on yearly basis. Conversely, quite inadequate results can be noted for Company B such its current assets found a decrease of some 2.07% in 2011 as compared to previous year. Similar movement in respect of both the companies can also be identified in relation to total assets where Company A presented brilliant results such that it increased around 41% in its total assets in 2011 as compared to last year. Company B however again displayed very slow paced results as its total assets remained inactive with the reduction of 0.87% in the 2011. Relatively varied results are observed in terms of current liabilities such that an addition of 43% in the current liabilities of Company A can be observed while an enormous decline of some 14% can also be noted, which is slightly an improved sign for the company under the existing current assets performance. Firm performance of Company A can be noted through an addition of around 9% in total equity of Company A which is poses a better indication for company. On opposing note, Company B remained stable as it hardly increased around 0.27% in the 2010 level of total equity. On the whole, the balance sheet pertaining to Company A has reflected fabulous growth whereas the balance sheet relating to Company B has been on a sluggish side with its 2010 levels and requires immediate steps to stimulate the asset growth of the company. Income Statement Analysis The income statement or profit and loss statement has numerous ingredients but only three out of them have been assessed here which are growth in terms sales, operating income and lastly the net income. As far as the sales growth for Company A is concerned, it can be observed that the company remained outstandingly well in comparison to Company B in the year 2011 such that the company A added its total sales by around 10% which turned out to be a quite a healthy sign. The performance of Company B remained below par as only 3% increase in its total sales can be noticed which is on a lower side. If operating income of both the companies is taken into consideration, Company B remained way ahead than Company A, as it increased some 64% in its operating income. On the contrary, very disappointing results for Company A can be noted where the company lost around 39% of its operating income as compared to previous year. Similar pattern can also be experienced in terms of net income where the Company A wiped put around 45% in the last year. Conversely, Company B presented a substantial difference and increased 56% of its net income. Overall, Company A only managed to increase its sales growth but it displayed some real depressing results in relation to operating and net income. However, Company B showed some fabulous results in all the three years and experienced an increase in every area in question. Cash Flow Statement Analysis Cash flow statements for both the companies have been assessed such that cash flows from all the three activities including operating, investing and financing activities have been analyzed. The operating activities of Company A have decreased the cash of nearly 25% as compared to previous year whereas in respect of Company B, a massive increase of 300% in cash has been experienced provided by operating activities only. As far as the investing activities are concerned, cash outflow for Company A has experienced an addition of a massive percentage of more 1600% in comparison to Company B, which experienced an outflow of over 260%. Cash increased due to financing activities amount to around 43% relating to Company A however, a rather stable cash flow position has been observed for Company B. By and large, cash flow statements of both the companies have presented significant vulnerability which needs to be controlled in order to better manage the cash flows. DuPont Analysis DuPont Analysis is undertaken in order to evaluate the driving forces behind Return on Equity. Three core factors that participate in shaping up the ROE are net profit margin, total asset turnover and lastly equity multiplier. If ROE for Company A is assessed, it can be noted that it is nearly around 11.38% which is on a higher side as compared to Company B which could not even touch 4% mark in terms of ROE. The main contributing cause behind this substantial addition in ROE for Company A is the equity multiplier which remained nearly 6 times. In respect of net profit margin, Company A has showed a bit slow results such that it could not produce even 1% net profit margin. However, nearly 2.27% net profit margin is generated by Company B. Conversely, total asset turnover for Company A managed to touch 2 whereas Company B remained near to 1.5 in his regard. It can be summarized that the core reason working behind the higher ROE for Company A is in fact its higher equity multiplier. Horizontal Analysis For horizontal analysis, every item of income statement and balance sheet is compared with a single parameter which is generally total sales and total assets respectively. The performance of the company is evaluated in such a manner that every component is assessed as the percentage of total sales or total assets. As far as the balance sheet of Company A is concerned, it can be noted that the total current assets amounted to nearly 97% of the total assets, which is very high reflecting very limited amount of investment has been made by the company in terms of fixed assets. Likewise, total current liabilities also amounted to nearly 78% of total assets, which also showed a very high percentage. If the equity portion is considered, the equity included in the capital structure of the company is very low amounting nearly 18% to 20% of the total assets. If the income statement for Company A is considered, it can be observed that the operating income amounted to hardly in between 2% and 4% of total sales which represents that the company is in its facing some resistance. Net income of the company amounted to nearly 2% of total sales in 2010 but remained below 1% in 2011. Conclusion The financial performance and position of Company A and Company B are evaluated under this article through vertical analysis and DuPont analysis. However, horizontal analysis was applied only in respect of Company A. As per the findings of the above mentioned analyses, the financial position and performance of Company A has been on a considerably better side as compared to Company B which showed some real disturbance across several areas. Horizontal analysis of Company A has reflected some impractical trends which pose some concerns against the profitability patterns of the company. Exhibits Vertical Analysis Company A December December Consolidated Balance Sheets 31, 2011 31, 2010     ASSETS   Current assets:   Cash 4,274 236.54 1,270 Trade accounts receivable (less allowance for doubtful   accounts of $527 and $331) 56,504 37.23 41,174 Inventories 184,113 39.27 132,196 Deferred tax assets 3,384 29.61 2,611 Other current assets 11,053 25.67 8,795 Total current assets 259,328 39.39 186,046 Advance to supplier, net of imputed interest of $521 4,479 0 Preferential supply agreement 521 0 Long-term financing costs, net of amortization 1,360 0 Property and equipment, net 4,040 (0.93) 4,078 Total assets 269,728 41.87 190,124     LIABILITIES AND STOCKHOLDERS EQUITY   Current liabilities:   Notes payable – banks 154,424 53.74 100,447 Current maturities of mortgage payable 160 5.96 151 Trade accounts payable 50,054 58.99 31,482 Income taxes payable 4,060 (33.91) 6,143 Accrued expenses and derivative liabilities 4,089 (61.19) 10,537 Dividends payable 231 0 Total current liabilities 213,018 43.20 148,760 Mortgage payable, net of current maturities 1,461 (9.87) 1,621 Subordinated convertible debt net of unamortized discount   of $2,499 9,501 0 Derivative liability for embedded conversion option 1,934 0 Deferred taxes payable 212 0 Stockholders equity:   Common stock $.01 par value, 20,000,000 shares authorized and   11,749,651 shares issued at December 31, 2011   and December 31, 2010 117 0.00 117 Additional paid-in capital 11,937 0.00 11,937 Retained earnings 35,271 12.92 31,235 Accumulated other comprehensive loss (214) 122.92 (96) Treasury stock 2,511,245 and 2,490,745 shares   at December 31, 2011 and December 31, 2010 (3,509) 1.71 (3,450) Total stockholders equity 43,602 9.71 39,743 Total liabilities and stockholders equity 269,728 41.87 190,124 Company B January 29,   January 30, CONSOLIDATED BALANCE SHEETS 2012 2011     Assets   Current assets   Cash and cash equivalents 40,355 142.77 16,623 Accounts receivable, less allowance for doubtful accounts of $1,632 and $2,082 on each date  25,807 (6.73) 27,670 Inventories 34,136 (40.57) 57,438 Prepaid expenses and other current assets 4,194 (15.53) 4,965  Total current assets 104,492 (2.07) 106,696 Property, plant and equipment, net 21,669 4.87 20,663 Intangible assets 1,257 (59.08) 3,072 Cash surrender value of life insurance policies 16,217 7.93 15,026 Other assets 5,536 11.75 4,954  Total assets 149,171 (0.82) 150,411     Liabilities and Shareholders Equity   Current liabilities    Trade accounts payable 9,233 (21.65) 11,785  Accrued salaries, wages and benefits 3,855 12.52 3,426  Other accrued expenses 792 (28.71) 1,111  Accrued dividends 1,078 0.09 1,077  Total current liabilities 14,958 (14.03) 17,399 Deferred compensation 7,100 13.75 6,242  Total liabilities 22,058 (6.70) 23,641 Shareholders equity   Common stock, no par value, 20,000 shares authorized , 10,793 and 10,782 shares issued and outstanding on each date  17,262 0.59 17,161  Retained earnings  109,742 0.68 109,000  Accumulated other comprehensive income 109 (82.10) 609  Total shareholders equity 127,113 0.27 126,770  Total liabilities and shareholders equity 149,171 (0.82) 150,411 Company A           Consolidated Statements of Operations         2,011 2,010 Net sales 514,633 10.67 465,013 Cost of goods sold 490,102 12.72 434,785 Gross profit 24,531 (18.85) 30,228 Selling, general and administrative expenses 13,336 10.85 12,031 Operating income before impairment recovery 11,195 (38.48) 18,197 Impairment recovery 0 (100.00) 346 Operating income 11,195 (39.63) 18,543 Other income/(expense)   Change in value of derivative liability 896 0 Interest expense, including amortization of debt discount (4,039) 1.05 (3,997) Income before income taxes 8,052 (44.64) 14,546 Income taxes 3,091 (42.77) 5,401 Net income 4,961 (45.75) 9,145 Weighted average shares outstanding:   Basic 9,255 (0.05) 9,260 Diluted 10,987 16.45 9,435 Earnings per share:   Basic 1 (45.45) 1 Diluted 0 (52.58) 1 Company B       CONSOLIDATED STATEMENTS OF OPERATIONS         January 29, January 30,   2012 2011     Net sales 222,505 3.28 215,429 Cost of sales 173,642 3.33 168,047   Casualty loss - 2,208   Insurance recovery - 1,708 Total cost of sales 173,642 3.02 168,547      Gross profit 48,863 4.23 46,882 Selling and administrative expenses 40,375 (1.58) 41,022 Restructuring charges - 1,403 Intangible asset impairment charges 1,815 358.33 396      Operating income 6,673 64.32 4,061 Other income (expense), net 272 151.85 108      Income before income taxes 6,945 66.59 4,169 Income taxes 1,888 103.23 929      Net income 5,057 56.08 3,240 Earnings per share:        Basic and diluted 0 56.67 0 Weighted average shares outstanding:        Basic 10,762 0.05 10,757      Diluted 10,790 0.19 10,770         Cash dividends declared per share 0   0 Company A       Consolidated Statements of Cash Flows 2001  2010   Cash flows from operating activities:   Net income 4,961 (45.75) 9,145 Adjustments to reconcile net income to net cash used in   operating activities:   Depreciation and amortization 434 16.04 374 Change in value of derivative liability (896) 0 Amortization of convertible note discount 330 0 Impairment recovery 0 (100.00) (346) Provision for doubtful accounts 207 0 Deferred income taxes (564) 1,662.50 (32) Foreign exchange loss, and other (11) (107.10) 155 Changes in:   Restricted cash 0 (100.00) 2,149 Trade accounts receivable (15,584) 17.66 (13,245) Inventories (52,368) 198.16 (17,564) Other current assets (2,332) (62.63) (6,240) Trade accounts payable 18,569 (187.12) (21,314) Income taxes payable (2,083) (146.91) 4,440 Accrued expenses and derivative liabilities (6,451) 207.04 (2,101) Net cash used in operating activities (55,788) 25.14 (44,579) Cash flows used in investing activities:   Advance related to supply agreement (5,000) 0 Net proceeds from sale of property and equipment 0 (100.00) 346 Purchases of property and equipment (84) 211.11 (27) Net cash (used in)/provided by investing activities (5,084) (1,693.73) 319 Cash flows provided by financing activities:   Proceeds from subordinated convertible debt 12,000 0 Proceeds from notes payable – banks 54,395 16.50 46,691 Repayments - mortgage payable (151) 7.09 (141) Dividends paid (694) (66.71) (2,085) Deferred financing costs (1,596) 0 Treasury stock purchased (59) (28.92) (83) Stock options exercised 0 (100.00) 18 Tax benefit from stock options exercised 0 (100.00) 11 Net cash provided by financing activities 63,895 43.87 44,411 Net increase in cash 3,023 1,901.99 151 Effect of exchange rate (19) (17.39) (23) Cash at beginning of year 1,270 11.21 1,142 Cash at end of the year 4,274 236.54 1,270 Supplemental disclosures of cash flow information:   Cash paid during the period for:   Interest 3,787 (6.19) 4,037 Income taxes 2,931 (48.74) 5,718 Non cash financing activities:   Dividend declared but not yet paid 231   $0 Company B       CONSOLIDATED STATEMENTS OF CASH FLOWS   (In thousands )         January 29, January 30,   2012 2011 Cash flows from operating activities      Cash received from customers 224,577 5.02 213,850    Cash paid to suppliers and employees (190,365) (226,986)    Insurance proceeds received on casualty loss - 1,708    Income taxes paid, net (1,987) (3,938)    Interest received (paid), net 51 (93)       Net cash provided by/(used in) operating activities 32,276 (15,459)     Cash flows from investing activities      Purchases of property, plant, and equipment (3,805) (2,010)    Proceeds received on notes receivable 35 12.90 31    Proceeds from the sale of property and equipment 125 -    Premiums paid on life insurance policies (1,144) (1,346)    Proceeds received on life insurance policies 560 (67.52) 1,724       Net cash used in investing activities (4,229) (1,601)     Cash flows from financing activities      Proceeds from short-term borrowing - -    Payments on short-term debt - -    Cash dividends paid (4,315) (4,312)    Payments on long-term debt - -       Net cash used in financing activities (4,315) (4,312)     Net increase (decrease) in cash and cash equivalents 23,732 (21,372) Cash and cash equivalents at the beginning of the year 16,623 (56.25) 37,995    Cash and cash equivalents at the end of the year 40,355 142.77 16,623     Reconciliation of net income to net cash provided by / (used in)     operating activities:      Net income 5,057 56.08 3,240       Depreciation and amortization 2,566 (9.90) 2,848       Non-cash restricted stock awards (38) 225       Asset impairment charges 1,815 358.33 396       Restructuring charge - 1,403       Loss on disposal of property 108 (8.47) 118       Provision for doubtful accounts 361 674       Gain on life insurance policies (565) (577       Deferred income taxes (36) (1,872)       Changes in assets and liabilities:            Trade accounts receivable 1,502 (2,451)          Inventories 23,302 (21,262)          Prepaid expenses and other current assets 451 (185)          Trade accounts payable (2,552) 1,360          Accrued salaries, wages, and benefits 429 (55.64) 967          Accrued income taxes (63) (1,136)          Other accrued expenses (256) 293          Deferred compensation 195 (61.00) 500          Other long-term liabilities - -             Net cash provided by/(used in) operating activities 32,276   (15,459) DuPont Analysis                 Return on Equity = Net Profit Margin x Asset Turnover x Financial Leverage         = Net Income x Total Sales x Total Assets     Total Sales Total Assets Total Equity       Company A = 4,961 x 514,633 x 269,728     514,633 269,728 43,602         = 0.96% x 1.908 x 6.186       ROE = 11.38%       Company B = 5,057 x 222,505 x 149,171     222,505 149,171 127,113         = 2.27% x 1.492 x 1.174       ROE = 3.98%                   Horizontal Analysis Company A     Balance Sheet Horizontal Analysis 2011 2010      ASSETS   Current assets:   Cash 1.58 0.67 Trade accounts receivable (less allowance for doubtful   accounts of $527 and $331) 20.95 21.66 Inventories 68.26 69.53 Deferred tax assets 1.25 1.37 Other current assets 4.10 4.63 Total current assets 96.14 97.86 Advance to supplier, net of imputed interest of $521 1.66 0.00 Preferential supply agreement 0.19 0.00 Long-term financing costs, net of amortization 0.50 0.00 Property and equipment, net 1.50 2.14 Total assets 100.00 100.00     LIABILITIES AND STOCKHOLDERS EQUITY   Current liabilities:   Notes payable - banks 57.25 52.83 Current maturities of mortgage payable 0.06 0.08 Trade accounts payable 18.56 16.56 Income taxes payable 1.51 3.23 Accrued expenses and derivative liabilities 1.52 5.54 Dividends payable 0.09 0.00 Total current liabilities 78.98 78.24     Mortgage payable, net of current maturities 0.54 0.85 Subordinated convertible debt net of unamortized discount   of $2,499 3.52 0.00 Derivative liability for embedded conversion option 0.72 0.00 Deferred taxes payable 0.08 0.00     Stockholders equity:   Common stock $.01 par value, 20,000,000 shares authorized and   11,749,651 shares issued at December 31, 2011   and December 31, 2010 0.04 0.06 Additional paid-in capital 4.43 6.28 Retained earnings 13.08 16.43 Accumulated other comprehensive loss (0.08) (0.05) Treasury stock 2,511,245 and 2,490,745 shares   at December 31, 2011 and December 31, 2010 (1.30) (1.81) Total stockholders equity 16.17 20.90 Total liabilities and stockholders equity 100.00 100.00 Company A     Income Statement   Horizontal Analysis 2011  2010         Net sales 100.00 100.00 Cost of goods sold 95.23 93.50 Gross profit 4.77 6.50 Selling, general and administrative expenses 2.59 2.59 Operating income before impairment recovery 2.18 3.91 Impairment recovery 0.00 0.07 Operating income 2.18 3.99 Other income/(expense) 0.00 0.00 Change in value of derivative liability 0.17 0.00 Interest expense, including amortization of debt discount (0.78) (0.86) Income before income taxes 1.56 3.13 Income taxes 0.60 1.16 Net income 0.96 1.97 References Baker, H. Kent . and Martin, Gerald S., 2011.Capital structure and corporate financing decisions: theory, evidence, and practice. New York: John Wiley & Sons. Berk, Jonathan B. and DeMarzo. Peter M., 2010. Corporate finance. 2nd ed. New York: Prentice Hall. Bierman, Harold., 2003. The capital structure decision. New York: Springer. Brigham, Eugene F. and Ehrhardt, Michael C., 2008. Financial management: theory and practice. 12th ed. New York: Cengage Learning. Eckbo, Bjørn Espen., 2008. Handbook of corporate finance: empirical corporate finance. Oxford: Elsevier. Jaffe, Jeffrey and Ross, Randolph Westerfield., 2004. Corporate Finance. New Delhi: Tata McGraw-Hill Education. Read More
Cite this document
  • APA
  • MLA
  • CHICAGO
(Financial Management Assignment Example | Topics and Well Written Essays - 2750 words, n.d.)
Financial Management Assignment Example | Topics and Well Written Essays - 2750 words. https://studentshare.org/finance-accounting/1773644-financial-management
(Financial Management Assignment Example | Topics and Well Written Essays - 2750 Words)
Financial Management Assignment Example | Topics and Well Written Essays - 2750 Words. https://studentshare.org/finance-accounting/1773644-financial-management.
“Financial Management Assignment Example | Topics and Well Written Essays - 2750 Words”. https://studentshare.org/finance-accounting/1773644-financial-management.
  • Cited: 0 times

CHECK THESE SAMPLES OF Capital Structure and Corporate Financing Decisions

The Reasons for Mergers and Acquisitions

This essay "The Reasons for Mergers and Acquisitions" identifies and examines economic reasons for acquisitions and mergers and discusses why the expected economic benefits may not be achieved.... The essay discusses the advantages and disadvantages of share repurchasing.... ... ... ... Sometimes the expected benefits out of a merger and acquisition may not be achieved by the firms....
6 Pages (1500 words) Essay

Central Financial Management Activities

While financial analysis happens to be the first essential step in the Financial Management process, cash flow management is the only way to make sure that a company can survive in the long run.... Financial Management involves both judgment and analysis, for both of which a manager needs complete information that paints the financial picture of an organization at any point in time.... It is not uncommon for an organization to employ its directors and/or its chairperson when it comes to judgment in the Financial Management process....
5 Pages (1250 words) Essay

FINANCIAL MANAGEMENT Assignments1-3

In other words, the delivery of services by the Financial Management Assignment Identify and Discuss Three Examples of Sociological, Demographic, or Cultural Forces China is one of the few countries in the world that has rejected pluralism; leaders are not involved in any way in any company.... The cloud based systems are growing rapidly and the Intuitive technology wants to offer the clients and prospective clients with complete accounting system and cloud Financial Management....
2 Pages (500 words) Essay

Financial Management

Financial Management for Public, Health, and Not-for-Profit Organizations.... Existence of monopolies is as a result of government's intervention following a failure in the free market.... The free market allows supply and demand forces to.... ... ... Therefore, in case the free market fails to achieve its goals, the government intervenes to provide public facilities, to avoid industry crowding, and finally protect the Monopolies Monopolies are specific entities that receive minimal competition in the provision of particular goods and services....
1 Pages (250 words) Essay

Financial Management

Financial Management plays an equally important role in public sector as well as in private sector.... So various roles that Financial Management plays in the public sector are.... Financial Management plays an equally important role in both private sector undertakings and private sector enterprises, however in public sector the policies and procedures are more Running Head: Financial Management Role of Financial Management in public sector organizations....
1 Pages (250 words) Essay

Financial Management

The increase in number of vehicles failing inspection is quite positive for the budget as it would lead to Financial Management For the operating monthly budget, see the attached excel spreadsheet.... Allocations take place because of the policies set by the management to fast track the company's operations; they must be obeyed to the letter.... With revenue collections going up, the personnel may be overwhelmed; therefore, there will be the need for DMV to be tougher in their standards to minimize pilferage of the revenue which would ultimately translate into huge profits at the end of the financial year....
2 Pages (500 words) Case Study

HEALTH CARE FINANCIAL MANAGEMENT

The article discusses the benefits and demerits of electronic transactions that relate to healthcare Financial Management.... Additionally, the article discusses the benefits and obstacles that Health Care Financial Management al Affiliation) The article, “Preparing for the New PPACA Electronic Payments Environment: What Healthcare Providers Need to Know” is relevant to our class in that it defines the new operating rules that govern healthcare transactions (Krah, 2013)....
1 Pages (250 words) Essay

Financial Management And Analysis

This can only be a success by a well-structured Financial Management system that blends new and old ideologies and create a balance that brings out the best returns to the internet business for selling academic materials.... ccording to various research activities within the analysis of Financial Management and entrepreneurship should be done through effectives methods of management.... The objective of this study is to show the current operation of Financial Management in firms with various entrepreneurial point of reference....
16 Pages (4000 words) Assignment
sponsored ads
We use cookies to create the best experience for you. Keep on browsing if you are OK with that, or find out how to manage cookies.
Contact Us