StudentShare
Contact Us
Sign In / Sign Up for FREE
Search
Go to advanced search...
Free

Financial Performance and Position of the Business - Assignment Example

Cite this document
Summary
In the report “Financial Performance and Position of the Business” the author provides financial ratio analysis, which can undoubtedly be regarded as one of the most effective methods. The financial appraisal of The GAME Group Plc can be performed by computing the appropriate financial ratios…
Download full paper File format: .doc, available for editing
GRAB THE BEST PAPER93.3% of users find it useful
Financial Performance and Position of the Business
Read Text Preview

Extract of sample "Financial Performance and Position of the Business"

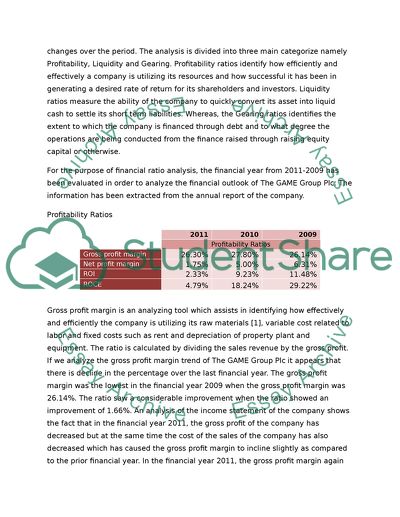
Question No Financial Performance and Position of the business In order to evaluate the financial performance of any organization, financial ratio analysis can undoubtedly be regarded as one of the most effective and efficient method. The financial appraisal of The GAME Group Plc can be performed by computing the appropriate financial ratios of the company and comparing it with the prior year in order to monitor growth or decline in the ratios. The financial ratio analysis provides the most effective result when it is compared with the benchmark ratios of the industry, but in the absence of the missing information, the ratios of the current year are compared with the ratios of the prior year. The financial ratio analysis also highlights the working capital condition of the company, whether the company is overtrading or not and how much finance would be required by the company in order to finance its working capital. Ratio analysis is considered to be a very accurate and reliable tool when it comes to analyzing and interpret the financial outlook and performance of an entity. The main reason for performing a ratio analysis is to quantify the results of the financial operations of an entity and analyze them in the light of financial performance of the prior year(s) in order to assess different aspects of the financial feasibility. [Peavler, R. (2001)] The financial ratios are usually divided into various sub categories such as profitability, gearing and liquidity, each put emphasis on a different area of the financial outlook of the organization. These analyses form an integral part of the financial statement analysis, especially from the investor’s point of view, which are always looking for avenues to invest in countries having strengthened and stabilized financial ratios and representing an upward trend. It is of great significance that the ratios must be benchmarked against a standard in order for them to possess a meaning. Keeping that into account, the comparison is usually conducted between companies portraying same business and financial risks, between industries and between different time periods of the same company. [Investopedia.com (2012] The financial ratio performance of The GAME Group Plc has been evaluated for the last three years in order to draw attention to various financial trends and significant changes over the period. The analysis is divided into three main categorize namely Profitability, Liquidity and Gearing. Profitability ratios identify how efficiently and effectively a company is utilizing its resources and how successful it has been in generating a desired rate of return for its shareholders and investors. Liquidity ratios measure the ability of the company to quickly convert its asset into liquid cash to settle its short term liabilities. Whereas, the Gearing ratios identifies the extent to which the company is financed through debt and to what degree the operations are being conducted from the finance raised through raising equity capital or otherwise. For the purpose of financial ratio analysis, the financial year from 2011-2009 has been evaluated in order to analyze the financial outlook of The GAME Group Plc. The information has been extracted from the annual report of the company. Profitability Ratios   2011 2010 2009   Profitability Ratios Gross profit margin 26.30% 27.80% 26.14% Net profit margin 1.75% 5.00% 6.31% ROI 2.33% 9.23% 11.48% ROCE 4.79% 18.24% 29.22% Gross profit margin is an analyzing tool which assists in identifying how effectively and efficiently the company is utilizing its raw materials [1], variable cost related to labor and fixed costs such as rent and depreciation of property plant and equipment. The ratio is calculated by dividing the sales revenue by the gross profit. If we analyze the gross profit margin trend of The GAME Group Plc it appears that there is decline in the percentage over the last financial year. The gross profit margin was the lowest in the financial year 2009 when the gross profit margin was 26.14%. The ratio saw a considerable improvement when the ratio showed an improvement of 1.66%. An analysis of the income statement of the company shows the fact that in the financial year 2011, the gross profit of the company has decreased but at the same time the cost of the sales of the company has also decreased which has caused the gross profit margin to incline slightly as compared to the prior financial year. In the financial year 2011, the gross profit margin again took a downward plunge causing a decline of 1.5%. This decline is due to the fact that the cost of sales of the company during the financial year 2011 surpassed the percentage increase in the revenue of the company as a result of which the profit margin of the company has decreased. The cause of the decline might be due to the increase in prices by the suppliers of the company or the wage rates of the labor of the company. Net profit margin, on the other hand analyzes the profitability of the company before deducting the taxation and finance charges from the earnings [2]. The ratio is calculated by dividing the profit after interest and tax with the sales revenue of the current financial period. The ratio highlights how well the company is managing its selling and administrative expenses it also highlights the other income generated by the company during the course of its operations. The net profit decreased significantly in the previous two financial years. The primary reason behind such decrease in the net profit margin is the major increase in the exceptional cost and finance expense of the company. During the non-current liabilities of the company i.e. long term borrowing and loans and advances although decreased but probably due to the surge in the interest rate, the company had to bear higher finance expense as a result of which the net profit margin has declines. Return on capital employed (ROCE) is, according to the analyst, is considered to be the most significant ratio in order to evaluate a company’s performance from an investor’s point of view. ROCE measures a company’s ability to earn a return on all of the capital that is being employed by the company [3]. The ratio is calculated as net income upon total capital employed, which is the sum of debt and equity financings. The return on capital employed has decreased significantly from the previous financial year as presented in the tabular representation. If we evaluate the tabular information, the ROCE increased sharply from the financial year 2009 to financial year 2011. The primary reason behind such decline is the massive decrease in the net profit for the company due to the increased finance charge and operational expenses during the year. An analysis of the balance sheet of the company would also reveal the fact that the total liability of the company has also increased during the current financial year which has a direct accelerated impact on the finance charge for the year. The reason behind such hiked up administrative expenses might be the cost expanded on the refurbishment and setting up of the new stores and outlets, which the company plans to open in the coming time. In addition, the finance charge of the company also increased during the current year due to the fact that the company acquired additional financing facilities from several banks and financial institutions in order to finance its working capital requirements. Liquidity and efficiency Ratios 2011 2010 2009 Liquidity Current ratio 1.09 1.07 0.94 Acid test ratio 0.62 0.46 0.48 Receivable days 10.90 9.95 10.28 Working Capital 29,627 20,641 (25,404) The liquidity ratio measures the company’s ability to pay its short term liabilities. The ratio illustrates that how quickly a company can convert its assets into cash and cash equivalent in order to pay off its short term liabilities [Investopedia.com (2012)]. The most commonly used liquidity ratio, the current ratio, which is calculated by comparing the current assets and current liabilities. The strengthened the current ratio the more ability the company has to pay its debts and short term obligations over the next 12 months. As apparent from the above financial ratio analysis, the current ratio of the company has always remained above 1 which shows that the company has the ability to discharge its current liabilities. The current ratio of the company has increased from the financial year 2009 to financial year 2011, which was primarily due to the increase in the cash balance of the company. A reason behind such increase would be due to the fact that the company has been able to collect its trade debts quickly and thus turning its sales revenue into cash a bit more quickly. The accounts receivable of the company increased considerably in line with the revenue. Although from one point of view, it appears to be a positive sign for the financial outlook of the company that its accounts receivable are increasing and correspondingly increasing its current asset ratio. But on the other hand, this shows that the company has been slower in recovering in cash from its customer thus resulting in a higher accounts receivable to revenue percentage. The acid test, which is also regarded as the quick ratio, is calculated by subtracting the inventory balance from the total current assert balance. Out of the current assets mentioned, inventories are regarded as the one which takes comparatively more time to be converted into cash or cash equivalent. The acid test ratio has followed the same trend as the current ratio and only marginal change has been experienced in the acid test ratio. Receivable collection days represent how quickly the cash is received from the debtors. The ratio is calculated by dividing the accounts receivable as per the balance sheet with the revenue for the period and multiplying the result with the days in the financial year. The formula calculates the number of days it takes to collect cash from the debtors on average. The higher the value the less efficient the management is in collecting debts. The debtor collection days has increased during the current financial year which shows that the company has become in efficient in collection the debts. The management of the company should put serious focus on its recovery department and should ensure that the collection period is reduced to the prior year figure or at least it is down to the industry average. In the absence of lower collection period, the company would have to finance its working capital through short term financing acquired from a bank or financial institution on which it will have to pay interest charges. The working capital of the company has also increased which is calculated by subtracting the current assets with the current liabilities of the company. The primary reason behind the increase in the working capital is due to the increase in the trade debts of the company. The additional working capital of the company is needed to be financed through the short term or long term borrowing acquired from any bank or financial institution. Company’s having positive and strengthened financial outlook finances their working capital requirement from internally generated funds and thus avoids incurring interest expenses on loans and advances acquired. Companies, such as The Game Plc, whose profitability ratio indicates that the company is facing financial difficulties, usually acquire the working capital requirements by obtaining funds from outside. The working capital of the company took showed a massive increase from the financial year 2009. In the year 2010, the company put focus on increasing its asset base, which is also represented from its current asset and acid test ratios. The working capital of the company further improved in the financial year 2011. Gearing ratios 2011 2010 2009 Gearing Ratios Equity ratio 0.49 0.51 0.39 Debt ratio 0.51 0.49 0.61 Debt : equity ratio 0.49:0.51 0.49:0.51 0.39:0.61 The gearing ratios and indicate the level of risk taken by a company as a result of its capital structure [Peavler, R. (2012)]. These ratios are a great source of determining the level of financial risk to which the company is exposed and thus helps in reducing it to the optimum. The equity ratio indicates how much of the entity’s assets are financed through the finances generated through the revenue generated from the operations of the entity and raising financing through equity issue rather than acquiring debts or other financial institution. It is apparent from the above mentioned tabular information that the debt equity ratio of the company has improved from the financial year 2009 as the company has been able to generate further equity through issuance of new shares as apparent from the increase in the share capital and the share premium account in the balance sheet of the company. In addition, the foreign exchange reserve of the company has also increased which is probably to the favorable movement of the company’s functional currency against the foreign currencies in which the company deals in. Question No. 2 (a) Computation of actual patient days Total Revenue 3,000,000 D Revenue per patient per day 150 B Total bed capacity 60 For 120 days the bed capacity was 100% i.e. 60 Total patient days for 12 days (120*60) 7,200 A Total Revenue earned during 120 days 1,080,000 C=A x B Remaining Revenue 1,920,000 E = D - C Remaining Days (i.e. other than 120 days) 245 F Bed occupancy for the remaining days 52 G = E/(F*B) Total Patient days 20,000 H = A + (F*G) Contribution margin statement Revenue 3,000,000 Variable Cost of Operation Catering (410,959) Laundry (136,986) Planning (365,297) Total (913,242) A Staffing Cost Supervisors (80,000) Nurses (150,000) Assistants (200,000) Total (430,000) B Contribution Margin 1,656,758 Fixed Cost Security (50,000) Administrative (650,000) Rent (750,000) Total (1,450,000) C Net profit 206,758 (b) Breakup patient days Total Variable cost 1,000,000 Total patient days 21,900 Variable cost per patient day 45.66 Revenue per patient day 150 Contribution margin per day 104 Total fixed cost (Staffing and Operational) 1,880,000 Patient days to break-even 18,018 (c) Breakup patient days (additional 20 beds) Total bed capacity 80 Total patient days for 120 days 9,600 Total patient days for remaining 245 days (@86.667%) 16,987 Total patient days 26,587 Revenue 3,988,000 Variable Cost of Operation Catering (546,301) Laundry (182,100) Planning (485,601) Total (1,214,003) Staffing Cost Supervisors (80,000) Nurses (225,000) Assistants (280,000) Total (585,000) Contribution Margin 2,188,997 Fixed Cost Security (50,000) Administrative (650,000) Rent (750,000) Total (1,450,000) Net profit 738,997 Breakup patient days Variable cost per patient day 45.66 Revenue per patient day 150 Contribution margin per day 104 Total fixed cost (Staffing and Operational) 2,035,000 Patient days to break-even 19,504 As apparent from the above calculation, both the contribution margin and the net profit of the hospital is likely to increase of the bed capacity of the hospital is increased by 20 beds to the total of 80 beds during the entire financial year. The fixed cost is unaffected by the level of capacity and is fixed irrespective if the bed capacity increases or decreases. In the marginal costing statement of income, the fixed overheads rate are not absorbed in the number of units produced, rather the total fixed cost, manufacturing and selling and administrative expenses are deducted separately from the contribution margin. Contribution margin statement is a widely accepted method of assessing the function and impacts of variable cost on the profitability of the company. It also assists the management of the company in analyzing which component of the variable cost is affecting the profit the most. From the managerial perspective, the marginal costing is the more relevant method for the analysis of cost and revenue information. This method of costing significantly assists the management in decision making process. In addition, the presentation of marginal costing is easily understandable by all the managers. Based on the above calculation, it is better to increase the bed capacity to 80 beds. Question No. 3 The corporate social responsibility is labeled under several names such strategic philanthropy, corporate citizenship and social responsibility. The main idea behind this terminology is to highlight the company’s involvement in assessing the impact that the business create on the environment. The CSR model being implemented in the organization worldwide is based on the ideology that the company is not only able to create value for its shareholders but it is also able to create value for the society in general. In various circumstances, the idea of the corporate social responsibility is questioned especially the motivation behind implementing such models. The critics of CSR are often seen brining the argument into lime light that it disrupts a corporation’s normal and legitimate operation and create a sort of distrust among the general public regarding the intentions of the organization. Ideologically, the critics rejects the idea of CSR based on the fact that in a capitalist society, the sole purpose of the survival of an organization is to generate return for its shareholders and its stakeholders and the safeguard and welfare of the general public rests with the government. Any effort of any organization which does not generate profit or return or increases the value of the firm is considered to be a waste of economic resources and is frowned upon by the critics of CSR at large. The argument presented is that if all of the corporations in the society acts did what it is supposed to do, a prosperous and just society would flourish with optimal allocation of resources. [Michael E. Porter and Mark R. Kramer] With all of the opposition from the critics of CSR, the corporations are working diligently to implement the CSR in its operational and corporate strategy. The primary motivation and idea behind CST is to create a private value for itself which is likely to create public value for the society. There are several companies all around the globe who have been successful in creating values for not only its shareholders but also for the society as well. Although it creates value for the company, to certain extent, there is a long going debate whether the cost of implementing the CSR exceeds the benefit derived from it. The tension between business goals and social/environmental goals cannot be wished away with the hope of co-creating private and public value. But despite its critics, the number of companies who are actively implementing CSR is increasing day by day. As per the latest study, more than 3,500 companies world-wide have successfully implemented CSR in its operational and corporate strategies. Astonishingly, the number of companies who used to implement CSR was around 1400 in the financial year of 2008 but since then the number has been inclining steadily. It would be interesting to note that most of the companies implementing CSR do not have either a strategic approach or conception of CSR, rather they practice an ad-hoc version of corporate social responsibility. The main driver behind the CSR practice comes from corporate leaders. Corporations and organizations are governed and lead by individuals and their direct impact is on the society in which they operate. CSR represents the softer side of the organization and their leader who strives to contribute towards the society. By doing so the leaders are likely to gain goodwill in the society and also their permission. [Milton Friedman ]Another primary driver of CSR is the civil society organizations and nongovernmental institutions who can often create pressure and compel corporations through various regulations that corporations attend to its responsibility of serving the society in general. It is also generally observed that once a corporate social responsibility activity is launched by a corporation, it is highly unlikely that it would be discontinued otherwise it is likely to further damage the reputation or goodwill of the company. It is generally observed in the corporate market that motivation in adapting to corporate social responsibility prevails more in private companies rather than the public companies. The reason behind this attribute is that the funds of the public company are highly monitored and released only after the approval of the relevant authorities. The tedious process often creates hurdles for public companies participating and implementing CSR. On the other hand, the funds of private companies are easily mobilized and there is less scrutiny on such funds due to which the companies are able to utilize its funds for CSR activities such as donation, building of hospitals, educational, sports and charitable institutions. From financial perspective, the CSR also increases the value of the firm. In a society, the investors are generally prone towards investing in companies which has great goodwill in the society and which is considered to fulfill social responsibility on a large scale. Due to this factor, the companies involved in CSR are generally has high market capitalization (i.e. the market value of the company in the stock market).[ Milton Friedman] Analysis of the global corporations such as Coca-Cola or Nestle, reveals the fact that the philanthropy activities conducted by such organization is either conducted by these organization themselves or through a foundation established solely for this purpose. For example the Coca-Cola corporation contributes around $88.1 million annually to various educational and philanthropist organization through the Coca-Cola Foundation. Other examples of in-kind giving include IBM’s computer donations through its global KidSmart Early Learning program16 and Microsoft’s donation of almost $300 million in software products to nongovernmental organizations (NGOs) across the globe. The motivation to indulge in CSR also depends upon the size of the corporation and its revenue. As a business grows, its market expands and it enters into other various markets both locally and internationally. It can be easily observed in the global market that giant multinational, such as coca-cola and Microsoft mentioned above, does not only work for the society where its headquarters are located but also in the international market where it has strong foothold. As a corporation move into several other cultural and socioeconomic environments, their philanthropic activity also increases subject to such exposures. In addition to the aforesaid, the commitment of the board of directors and corporate decision makers may also be personally committed to a wide range of charitable institutions which derives the corporations to take part in CSR. When corporations indulge themselves in CSR, they would want the society, its shareholders and stakeholders to know that they are providing benefit to the society by giving those services and benefits. Keeping that into consideration, these corporations publish the particulars in their annual reports as a separate section or sometimes they publish these documents separately from the annual report. This can be regarded as a tactical and strategic move on the part of corporations as not only it will fulfill any legal or regulatory requirement to publish such information, but it will also act as an advertisement instrument which will increase its goodwill in the eyes of the general public. References [1] Peavler, R. (2001) Profitability Ratio Analysis. [online] Available at: http://bizfinance.about.com/od/financialratios/a/Profitability_Ratios.htm [Accessed: June 24 2013]. [2] Peavler, R. (2013) Debt and Equity Financing. [online] Available at: http://bizfinance.about.com/od/generalinformatio1/a/debtequityfin.htm [Accessed: June 24 2013]. [3] Qfinance.com (2010) Gearing Ratios - Definition of Gearing Ratios - QFINANCE. [online] Available at: http://www.qfinance.com/dictionary/gearing-ratios [Accessed: June 24 2013]. [4] R.A. Brealey, S.C. Myers and F. Allen. (2011) Principles of Corporate Finance. 11th ed. McGraw-Hill/Irwin [5] Neale, R. P. (2003). Corporate Finance and Investment Decisions and Strategies . London: Prentice Hall. [6] Investopedia.com (2012) Equity Financing Definition | Investopedia. [online] Available at: http://www.investopedia.com/terms/e/equityfinancing.asp [Accessed: June 24 2013]. [7] Investopedia.com (2012) Profitability Indicator Ratios: Profit Margin Analysis | Investopedia. [online] Available at: http://www.investopedia.com/university/ratios/profitability-indicator/ratio1.asp [Accessed: June 24 2013]. [8] Investopedia.com (2012) Understanding Financial Liquidity. [online] Available at: http://www.investopedia.com/articles/basics/07/liquidity.asp [Accessed: June 24 2013]. [9] Investopedia.com (2013) Effects of Debt on the Capital Structure – CFA Level 1 | Investopedia. [online] Available at: http://www.investopedia.com/exam-guide/cfa-level-1/corporate-finance/debt-effects-capital-structure.asp [Accessed: June 24 2013]. [10] Abeysinghe, R. L., 2010. Nature and introduction of investment decision. [Online] Available at [Accessed 24 June 2013]. [11] Hearst Communication.com (2013) Advantages and disadvantages of Venture Capital |. [online] Available at: http://smallbusiness.chron.com/advantages-disadvantages-selling-stock-raise-funds-small-business-46585.html [Accessed: June 24 2013]. [12] Studyfinance.com (1999) StudyFinance: Types of Business Organization. [online] Available at: http://www.studyfinance.com/lessons/busorg/ [Accessed: June 24 2013]. [13] Milton Friedman, “The Social Responsibility of Business is to Increase its Profits,” New York Times, September 13, 1970. [14] Milton Friedman, “The Social Responsibility of Business is to Increase its Profits,” New York Times, September 13, 1970. [15] Michael E. Porter and Mark R. Kramer, “The Competitive Advantage of Corporate Philanthropy,” Harvard Business Review (December 2002). Read More
Cite this document
  • APA
  • MLA
  • CHICAGO
(Financial Performance and Position of the Business Assignment - 1, n.d.)
Financial Performance and Position of the Business Assignment - 1. Retrieved from https://studentshare.org/finance-accounting/1802297-msc-managerial-finance-resit-assignment-june-2013
(Financial Performance and Position of the Business Assignment - 1)
Financial Performance and Position of the Business Assignment - 1. https://studentshare.org/finance-accounting/1802297-msc-managerial-finance-resit-assignment-june-2013.
“Financial Performance and Position of the Business Assignment - 1”, n.d. https://studentshare.org/finance-accounting/1802297-msc-managerial-finance-resit-assignment-june-2013.
  • Cited: 0 times

CHECK THESE SAMPLES OF Financial Performance and Position of the Business

Strategic Financial Management - Marks and Spencer

… A study reflects a sound business performance of the company with satisfactory revenue through its sales and this status has been maintained inspite of several challenges and difficulties that the company had to face in the light of changing economic conditions in the business world.... This report focuses on studying the strategic financial management of M&S that leads the company in its industry resulting in improved business outputs and financial results and a comparative study with Next Retail limited and Debenhams Plc....
14 Pages (3500 words) Essay

Strategic Management of CVS Caremark Company and Coinstar

It is recommended that the CVS Caremark shouldn't acquire Coinstar due to the difference in their areas and scale of business, strategic positioning and financial positing.... The CVS has a strong financial status with billions of dollars of sales and large scale of operation while the Coinstar though has a lot of presence in many countries is also a profitable business.... hellip; CVS Caremark Company seems to have a strong financial position based on its public financial results....
10 Pages (2500 words) Assignment

Financial Performance of a Business

It is stated that in order to understand the financial strength and financial status of the business, every enterprise should prepare certain statements known as financial statements.... These statements help in knowing the profitability and financial soundness of the business concern.... The author of this assignment "financial performance of a Business" casts light on the main financial statements.... A fixed asset is an asset held with the intention of being used for the purpose of producing or providing goods or services, and it is not meant for sale in the normal course of business (Accounting for Fixed Assets n....
6 Pages (1500 words) Assignment

TR Limited: Financial Evaluation and Financing Decisions

12 Pages (3000 words) Essay

Profitability Ratio Analysis

Financial Performance and Position of the Business In order to evaluate the financial performance of any organization, financial ratio analysis can undoubtedly be regarded as one of the most effective and efficient method.... The main reason for performing a ratio analysis is to quantify the results of the financial operations of an entity and analyze them in the light of financial performance of the prior year(s) in order to assess different aspects of the financial feasibility....
15 Pages (3750 words) Assignment

Accounting standards board

This occurs where the business has more expenses than the sale price.... This is what the firm has in the business that does not actually belong to it but it is borrowed.... For example the business might have taken a long from the bank of 10,000 to boost the business.... Ownership Interest: This is usually what the owner of the firm has actually contributed to the business.... For example if a business sells a commodity for 4000 and this commodity had cost it 2500....
3 Pages (750 words) Essay

Case study accounting

The following is a brief analysis of the business information provided by Wadhha.... As she was new to the business and commercial life being associated with Navy for several years, she took over an existing business and analysed all the aspects through which the… After going through the various business needs, she figured out the need of keeping and maintaining proper accounting system for better cost allocation and recording of operating and financial information....
4 Pages (1000 words) Essay

Statement of Financial Position

The analysis of information by investors enables them to compare the past performance of the company, the position of the company with other industry and the whole market at large.... The paper 'Statement of Financial Position' presents many companies that use the statement of financial position to evaluate their performances in the business.... This information shows the baseline of company and indicates the least amount required for an investor to start the business....
8 Pages (2000 words) Term Paper
sponsored ads
We use cookies to create the best experience for you. Keep on browsing if you are OK with that, or find out how to manage cookies.
Contact Us