StudentShare
Contact Us
Sign In / Sign Up for FREE
Search
Go to advanced search...
Free

Analysis of Recovery of Patients with Brain Injuries - Report Example

Cite this document
Summary
The aim of the paper "Analysis of Recovery of Patients with Brain Injuries " is at investigating a number of aspects that affect the recovery of the participants who have incurred head injuries and thus awaiting the results of litigation as well as the amount they will receive at long last. The study took place over a period twenty years and involved patients from all states in the country…
Download full paper File format: .doc, available for editing
GRAB THE BEST PAPER96.5% of users find it useful
Analysis of Recovery of Patients with Brain Injuries
Read Text Preview

Extract of sample "Analysis of Recovery of Patients with Brain Injuries"

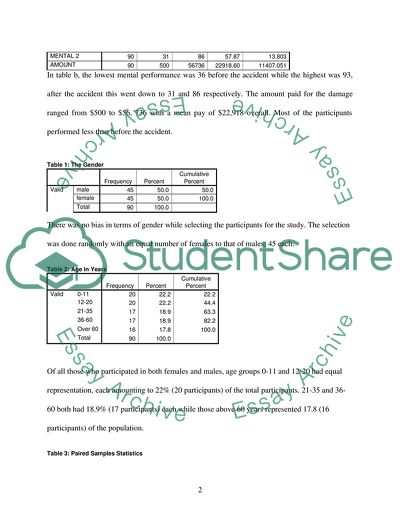
Introduction In order for any organization to make tangible decisions, data has to back the assertions. This data should be reliable and valid. The data should be unbiased as well as being randomly collected. Both males and females should be represented if the study is to meet the required scientific rigor. This data was collected within the Australian court system. The participants in the study are human beings who had suffered brain injury in motor accidents and who had sue thereafter for money to compensate for damages based on their injury. The study was carried out by Professor J. Chaseling of Griffiths University in Brisbane. It was aimed at investigating a number of aspects which affect the recovery of the participants who have incurred head injuries and thus awaiting the results of litigation as well as the amount they will receive at long last. The study took place over a period twenty years and involved patients from all states in the country. Of the total 200 who initially had registered to take took part, only 90 qualified randomly from the sample; 45 male and 45 females. The data is analyzed using SPSS version 11 and the results follow below. Results Table a: gender vs. age Age in Years 0-11 12-20 21-35 36-60 Over 60 The Gender male 12 12 7 8 6 female 8 8 10 9 10 From table a above, the number of males whose age is less than 20 were 24, 7 were between 21-35 years, 8 between 36-60 years while the remaining 6 were above 60 years. In females, between 0-20 were 16, 10 were between 21-35, 9 between 36-60 while 10 were above 60 years of age. Table b: Descriptive Statistics N Minimum Maximum Mean Std. Deviation Age in Years 90 1 5 2.88 1.421 MENTAL 1 90 36 93 67.32 13.485 MENTAL 2 90 31 86 57.87 13.803 AMOUNT 90 500 56736 22918.60 11407.051 In table b, the lowest mental performance was 36 before the accident while the highest was 93, after the accident this went down to 31 and 86 respectively. The amount paid for the damage ranged from $500 to $56, 736 with a mean pay of $22,918 overall. Most of the participants performed less than before the accident. Table 1: The Gender Frequency Percent Cumulative Percent Valid male 45 50.0 50.0 female 45 50.0 100.0 Total 90 100.0 There was no bias in terms of gender while selecting the participants for the study. The selection was done randomly with an equal number of females to that of males; 45 each. Table 2: Age in Years Frequency Percent Cumulative Percent Valid 0-11 20 22.2 22.2 12-20 20 22.2 44.4 21-35 17 18.9 63.3 36-60 17 18.9 82.2 Over 60 16 17.8 100.0 Total 90 100.0 Of all those who participated in both females and males, age groups 0-11 and 12-20 had equal representation, each amounting to 22% (20 participants) of the total participants. 21-35 and 36-60 both had 18.9% (17 participants) each while those above 60 years represented 17.8 (16 participants) of the population. Table 3: Paired Samples Statistics Mean N Std. Deviation Std. Error Mean Pair 1 MENTAL 1 67.32 90 13.485 1.421 MENTAL 2 57.87 90 13.803 1.455 From table 3 above, it is evident that, before the accident occurred, the brains used to perform better and had a mean of 67.32 and a standard deviation of 13.5. After the accident, the mean performance reduced to 57.87 with a standard deviation of 13.8 Table 4: Paired Samples Test Mean 95% Confidence Interval of the Difference Lower Upper P Pair 1 MENTAL 1 – MENTAL 2 9.46 7.83 11.08 .000 The mean in the difference of mental performance had a mean of 9.46 in favour of mental 1. The difference between the two is significant at 95% level of significance. Table 5: Group Statistics The Gender N Mean Std. Deviation Std. Error Mean MENTAL 1 male 45 67.00 14.774 2.202 female 45 67.64 12.220 1.822 Before the accidents, the female’s mental performance was better, 67.64 while males had 67 mean in mental performance. Table 6: Independent Samples Test t df Sig. (2-tailed) Mean Difference 95% Confidence Interval of the Difference Lower Upper MENTAL 1 -.225 88 .822 -.64 -6.324 5.035 The difference in mental performance between females and males is not significant at all. We can say with certainty that males performed as females did at 95% confidence level. Table 7: Group Statistics The Gender N Mean Std. Deviation Std. Error Mean MENTAL 2 male 45 55.24 14.626 2.180 female 45 60.49 12.546 1.870 After the accidents, females still did better than their counterparts with a mean of 60.49 and standard deviation of 12.54 while males had 55.24 with a standard deviation of 14.63 Table 8: Independent Samples Test t df Sig. (2-tailed) Mean Difference 95% Confidence Interval of the Difference Lower Upper MENTAL 2 -1.826 88 .071 -5.24 -10.953 .464 Like before the accident, the difference in mean performance which is -.24, is not significant at all at 95% confidence level. Table 9: ANOVA Sum of Squares df Mean Square F Sig. Between Groups 9457.729 4 2364.432 29.881 .000 Within Groups 6725.926 85 79.129 Total 16183.656 89 The performance was significantly different among the different age groups with p=0.000 at 95% confidence level and an F=29.881 Table 10: Multiple Comparisons (mental 1) (I) Age in Years (J) Age in Years Mean Difference (I-J) Std. Error Sig. 95% Confidence Interval Lower Bound Upper Bound 0-11 12-20 -25.50(*) 2.813 .000 -31.09 -19.91 21-35 -21.97(*) 2.934 .000 -27.81 -16.14 36-60 -27.44(*) 2.934 .000 -33.28 -21.61 Over 60 -15.88(*) 2.984 .000 -21.81 -9.94 12-20 0-11 25.50(*) 2.813 .000 19.91 31.09 21-35 3.53 2.934 .232 -2.31 9.36 36-60 -1.94 2.934 .510 -7.78 3.89 Over 60 9.63(*) 2.984 .002 3.69 15.56 21-35 0-11 21.97(*) 2.934 .000 16.14 27.81 12-20 -3.53 2.934 .232 -9.36 2.31 36-60 -5.47 3.051 .077 -11.54 .60 Over 60 6.10 3.098 .052 -.06 12.26 36-60 0-11 27.44(*) 2.934 .000 21.61 33.28 12-20 1.94 2.934 .510 -3.89 7.78 21-35 5.47 3.051 .077 -.60 11.54 Over 60 11.57(*) 3.098 .000 5.41 17.73 Over 60 0-11 15.88(*) 2.984 .000 9.94 21.81 12-20 -9.63(*) 2.984 .002 -15.56 -3.69 21-35 -6.10 3.098 .052 -12.26 .06 36-60 -11.57(*) 3.098 .000 -17.73 -5.41 * The mean difference is significant at the .05 level. From table 10 above, it is clearly seen from the analysis that, age group 0-11 was significantly different from the other groups; 12-20, 21-35, 36-60 and above 60 at 95% in terms of performance before the accidents. Age group 12-20 had the same performance as age group 21-35 and 36-60 and was different from 0-11 and above 60 years. 21-35 was different from 0-11 and the same with the other groups. 36-60 had the same performance to 12-20 and 21-35 while different from 0-11 and above 60. Above 60 ad the same performance to 21-35 and different from the other age groups. Table 11: ANOVA (mental 2) Sum of Squares df Mean Square F Sig. Between Groups 8696.203 4 2174.051 22.372 .000 Within Groups 8260.197 85 97.179 Total 16956.400 89 After the accidents, the performance in the various age groups was also different at 95% level of significance. Table 12: Multiple Comparisons (Mental 2) (I) Age in Years (J) Age in Years Mean Difference (I-J) Std. Error Sig. 95% Confidence Interval Lower Bound Upper Bound 0-11 12-20 -25.35(*) 3.117 .000 -31.55 -19.15 21-35 -17.04(*) 3.252 .000 -23.51 -10.58 36-60 -17.34(*) 3.252 .000 -23.80 -10.87 Over 60 -2.75 3.306 .408 -9.32 3.82 12-20 0-11 25.35(*) 3.117 .000 19.15 31.55 21-35 8.31(*) 3.252 .012 1.84 14.77 36-60 8.01(*) 3.252 .016 1.55 14.48 Over 60 22.60(*) 3.306 .000 16.03 29.17 21-35 0-11 17.04(*) 3.252 .000 10.58 23.51 12-20 -8.31(*) 3.252 .012 -14.77 -1.84 36-60 -.29 3.381 .931 -7.02 6.43 Over 60 14.29(*) 3.434 .000 7.47 21.12 36-60 0-11 17.34(*) 3.252 .000 10.87 23.80 12-20 -8.01(*) 3.252 .016 -14.48 -1.55 21-35 .29 3.381 .931 -6.43 7.02 Over 60 14.59(*) 3.434 .000 7.76 21.42 Over 60 0-11 2.75 3.306 .408 -3.82 9.32 12-20 -22.60(*) 3.306 .000 -29.17 -16.03 21-35 -14.29(*) 3.434 .000 -21.12 -7.47 36-60 -14.59(*) 3.434 .000 -21.42 -7.76 * The mean difference is significant at the .05 level. In age group 0-11, the performance was different from that in age groups 12-20, 21-35 and 36-60 and was the same as that in above 60 years. The performance in 12-20 was different from that in all the other groups. The performance in 21-25 was the same as that in 36-60 and different from the other groups. Between 35 and 60, the performance was the same as the performance in 21-35 and different from the other groups. Over 60 was the same as 0-11 and different from the other groups. Table 13: Group Statistics The Gender N Mean Std. Deviation Std. Error Mean AMOUNT male 45 26655.62 11844.564 1765.683 female 45 19181.58 9712.867 1447.909 In terms of the amount paid after the law suit, males got $26,655.62 while females got $19,181.58 after the law suit was completed. Table 14: Independent Samples Test t df Sig. (2-tailed) Mean Difference 95% Confidence Interval of the Difference Lower Upper AMOUNT 3.273 88 .002 7474.04 2936.196 12011.893 The amount paid to females is less than the amount paid to males by $7,474 (mean). This difference is significant at 95% confidence interval. Table 15: ANOVA Sum of Squares df Mean Square F Sig. Between Groups 3630986756.615 4 907746689.154 9.706 .000 Within Groups 7949766454.985 85 93526664.176 Total 11580753211.600 89 Within the age groups as shown by table 15 above, the amount paid is different at 95% CI Table 16: Multiple Comparisons (I) Age in Years (J) Age in Years Mean Difference (I-J) Std. Error Sig. 95% Confidence Interval Lower Bound Upper Bound 0-11 12-20 -188.05 3058.213 .951 -6268.60 5892.50 21-35 4314.77 3190.282 .180 -2028.37 10657.90 36-60 12662.47(*) 3190.282 .000 6319.34 19005.61 Over 60 15165.15(*) 3243.725 .000 8715.76 21614.54 12-20 0-11 188.05 3058.213 .951 -5892.50 6268.60 21-35 4502.82 3190.282 .162 -1840.32 10845.95 36-60 12850.52(*) 3190.282 .000 6507.39 19193.66 Over 60 15353.20(*) 3243.725 .000 8903.81 21802.59 21-35 0-11 -4314.77 3190.282 .180 -10657.90 2028.37 12-20 -4502.82 3190.282 .162 -10845.95 1840.32 36-60 8347.71(*) 3317.098 .014 1752.43 14942.98 Over 60 10850.38(*) 3368.529 .002 4152.85 17547.92 36-60 0-11 -12662.47(*) 3190.282 .000 -19005.61 -6319.34 12-20 -12850.52(*) 3190.282 .000 -19193.66 -6507.39 21-35 -8347.71(*) 3317.098 .014 -14942.98 -1752.43 Over 60 2502.68 3368.529 .460 -4194.86 9200.21 Over 60 0-11 -15165.15(*) 3243.725 .000 -21614.54 -8715.76 12-20 -15353.20(*) 3243.725 .000 -21802.59 -8903.81 21-35 -10850.38(*) 3368.529 .002 -17547.92 -4152.85 36-60 -2502.68 3368.529 .460 -9200.21 4194.86 * The mean difference is significant at the .05 level. The difference among the groups is as show above. 0-11 got almost the same as 12-20 and 21-35 although the amount different from that in 36-60 and above 60. 12-20 had the same amount as 0-11 and 21-35 but different from 36-60 and above 60 years. 21-35 had the same amount as 0-11, 12-20 and different from 36-60 and above 60. At the same time, 36-60 had a different amount than that in 0-11, 12-20 and 21-35 but the same amount as above 60 years. Over 60 had the same amount as 36-60 an amount different from the other age groups; 0-11, 12-20 and 21-35. Table 17: Coefficients Model standardized Coefficients t Sig. B Std. Error 1 Constant 29371.418 6150.212 4.776 .000 MENTAL 1 -95.850 89.595 -1.070 .288 Dependent Variable: AMOUNT The coefficients table 17 above confirms that, the amount paid can be expressed as an equation of the mental performance before the accident. The two coefficients b0 and b1 are, 29371.42 and -95.85 respectively. The equation can be formulated as below. A = 29371.42 – 95.85 Mental 1…………………………………..1 This means that, the mental performance before the accident contributes towards the amount paid by a negative factor which is 95.85 and lies between -273.9 and 82.2. This factor is not significant at all in the amount. The constant which is 29371 is significant at 95% CI and lies between 17149.16 and 41593.67. Table 18: Coefficients Model standardized Coefficients t Sig. B Std. Error 1 Constant 23468.118 5238.976 4.480 .000 MENTAL 2 -9.496 88.091 -.108 .914 Dependent Variable: AMOUNT The mental performance after the accident contributes a negative towards the final amount awarded. The two coefficients b0 and b1 are, 23468.118 and -9.496 respectively. The equation can be formulated as below. A = 23468 – 9.496 Mental 2………………………………………………..2 Which means that, the mental performance after the accident contributes towards the amount paid by a negative factor which is 9.496 and lies between -184.55 and 165.56? This factor is not significant at all in the amount. The constant which is 23468.11 is significant at 95% CI and lies between 13056.75 and 33879.48. Table 19: Coefficients Model standardized Coefficients t Sig. B Std. Error 1 (Constant) 25376.360 1883.584 13.472 .000 The difference in mental perfomance before & after the accident -259.928 154.396 -1.684 .096 Dependent Variable: AMOUNT From table 19 above, the difference in mental performance is not significant. It can be expressed as an equation for the amount received after the law suits as below since the two coefficients b0 and b1 are, 25376 and -259.93 respectively as below, A = 25376 – 259.93 D………………………………………….3, where A is amount and D if the difference. This shows that the difference in performance has a factor of -259.93 which is not significant at all. Table 20: Coefficients Model standardized Coefficients t Sig. B Std. Error 1 (Constant) 35233.144 2321.622 15.176 .000 Age in Years -4279.185 724.172 -5.909 .000 Dependent Variable: AMOUNT From the above table, A = 35233.14 – 4279.19 Age in years………………………4, This means that, when the age changes from one age groups to the other, the amount changes with a value of 4279.19. This value is significant as far as the amount paid is concerned. At the same time, the constant is also significant at 95% level of significance. Table 21: Mean vs. age group Age in Years Mean N Std. Deviation 0-11 28779.65 20 12520.938 12-20 28967.70 20 9461.933 21-35 24464.88 17 9965.210 36-60 16117.18 17 7121.484 Over 60 13614.50 16 7614.426 Total 22918.60 90 11407.051 From table 21, it is evident that, 12-20 years received the huge payments with a mean of $28,967 followed by 1-11 with a mean of $28,779. 21-35 had a mean of $24,464 while 36-60 had a mean of $16,117. Over 60 had the lowest pay of $13,614. Conclusion The above analysis confirms that, the level of mental perfomance in females before and after the accident is the same as the amount in males before and after. Further, it is evident that, those lying between 0 and 11 years and those above 60 have the same performance before and after the accident, may be due to age. 0-11 had the highest pay may be due to the age as the young are delicate and are considered to be the future of the society. It is a confirmation that, after accidents, the probability of failing to operate well is high. Reference National Institute of Aging (2007). Mental Performance [Updated 19 October, 2007]. Retrieved February 01, 2008 from www.maccs.mq.edu.au/publications/annreports/MACCS_2001.pdf Read More
Cite this document
  • APA
  • MLA
  • CHICAGO
(Analysis of Recovery of Patients with Brain Injuries Report, n.d.)
Analysis of Recovery of Patients with Brain Injuries Report. https://studentshare.org/health-sciences-medicine/1712265-presenting-results-of-analysed-data-set-using-appropriate-statistical-package-eg-spss
(Analysis of Recovery of Patients With Brain Injuries Report)
Analysis of Recovery of Patients With Brain Injuries Report. https://studentshare.org/health-sciences-medicine/1712265-presenting-results-of-analysed-data-set-using-appropriate-statistical-package-eg-spss.
“Analysis of Recovery of Patients With Brain Injuries Report”. https://studentshare.org/health-sciences-medicine/1712265-presenting-results-of-analysed-data-set-using-appropriate-statistical-package-eg-spss.
  • Cited: 0 times

CHECK THESE SAMPLES OF Analysis of Recovery of Patients with Brain Injuries

Phineas Gage

Aside from these residual effects, Gage seemed normal in terms of his physical health and that he had recovered from his injuries, with no acute pain in his head.... Phineas Gage is a commonly used name in the field of psychology for many reasons, the primary of which is the proof that Gage's case study gave for the thought that the mind is not simply a physical aspect of the brain....
5 Pages (1250 words) Research Paper

Health Sciences and Medicine: Symptoms Experienced During Severe Brain Damage

One of the most common types of traumatic brain injuries is concussion which involves the brain being severely shaken.... Children engage in so many activities and hence are quite prone to head injuries which could be minor or major as the case may be.... hellip; Head injuries range from a small bump on the head to Traumatic Brain Injury (TBI) which involves serious injury to the brain.... There are two types of head injuries which are discussed below in order for us to understand when or why vomiting takes place....
6 Pages (1500 words) Essay

Behavior Couples Therapy for Alcoholism and Drug Abuse

During the weekly meeting with the therapist, the couple gets an opportunity of reviewing their performance on the daily recovery contracts through analysis of the daily records.... Some patients will require medication to foster their abstinence.... Substance-Focused Interventions in Behavior Couple's Therapy Therapists advise a couple to commit to a daily recovery contract that includes a ‘trust discussion'.... The daily recovery contract requires the couple to devote to reserve a few minutes each day for the patient to take the relevant medication to aid in abstinence....
5 Pages (1250 words) Research Paper

Cognitive Neuropsychology

Certain injuries to the brain or brain tumors require quick and early intervention to save the life of the person affected.... These injuries require immediate attention because delay can result in permanent brain damage or the loss of life.... The paper "Cognitive Neuropsychology " describes that for understanding cognitive processes and the functioning of the brain, it is imperative to understand that it is not compulsory that the brain be damaged in order to exhibit certain abnormal or unusual anomalies....
8 Pages (2000 words) Essay

Nursing Care in Cases of Multiple Sclerosis

Along with periodical nursing care, family members are the best caregivers for patients with the above diseases.... Time and again, there are awesome accounts of patients receiving the healing touch because of the nature of care received from a particular doctor, nurse or nurses (McConnell, Virginia; 2009).... patients have access to medical advice and similar cases online and can be extremely curious and choosy about medicines prescribed.... Hence, medical practitioners must be prepared for queries from patients or their relatives about a particular line of treatment and the medicines prescribed....
5 Pages (1250 words) Essay

Patient Case Studies in Understanding Cognitive Processes

This knowledge has helped neuropsychologists and other specialists be able to understand how to deal with problems associated with brain functioning.... However, patient case studies heavily rely on generalizations that are a difficult issue to achieve on an exact basis when studying the brain.... Despite the fact that the use of patient case studies is not a 100 percent way of accurately understanding cognitive processes, it has helped neuropsychologists increase their accuracy by providing ways to infer with regard to the part of the brain that is responsible for a certain cognitive ability....
8 Pages (2000 words) Coursework

Traumatic Brain Injury's Severity Assessment, Treatment and Rehabilitation - Concussion Prevention is Better than Cure

Normal life rules such as always using safety belts when driving, using headgears when cycling, obeying traffic rules as a pedestrian or driver and disengaging in violent acts such as riots and street fights are some of the basic aspects to be considered in the strive to prevent cases of traumatic brain injuries.... Concussion occurs as a result of external forces that come into contact with the head resulting to injuries in the brain thus causing a malfunction in the nervous system (Desrocher & Autism....
3 Pages (750 words) Term Paper

Ethical Trends in Healthcare

CAT scans were done; Magnetic Resonance imaging (MRI) was performed followed by a neurosurgery to remove a malignant brain tumor.... The recommendation of health professional for Roda to undergo CAT scans and be sent to MRI for further investigation was to verify a diagnosis, a suspected malignant brain tumor or a brain stem tumor.... NTRODUCTIONNurses are health professionals that are involved in direct contact with patients....
6 Pages (1500 words) Essay
sponsored ads
We use cookies to create the best experience for you. Keep on browsing if you are OK with that, or find out how to manage cookies.
Contact Us