StudentShare

Our website is a unique platform where students can share their papers in a matter of giving an example of the work to be done. If you find papers
matching your topic, you may use them only as an example of work. This is 100% legal. You may not submit downloaded papers as your own, that is cheating. Also you
should remember, that this work was alredy submitted once by a student who originally wrote it.
✕
Free
Financial Management Measures - Discounted Payback Period - Assignment Example
Summary
This paper "Financial Management Measures - Discounted Payback Period" focuses on the two shortlisted proposals for the Poladian PLC to improve the situation of the company due to the current global crisis. The proposals were analyzed on different financial measures: NPV, IRR, etc. …
- Subject: Finance & Accounting
- Type: Assignment
- Level: High School
- Pages: 5 (1250 words)
- Downloads: 0
- Author: jayce56
Extract of sample "Financial Management Measures - Discounted Payback Period"
Financial Management Measures - Discounted Payback Period
We have analyzed two shortlisted proposals for the Polasian PLC to improve the situation of the company due to current global crisis. The proposals were analyzed on different financial measures: NPV, IRR, discounted payback period and ROCE. The results have been presented below and recommendations have been proposed.
FINANCIAL MANAGEMENT MEASURES
Discounted Payback Period
Discounted Payback period is the amount of time required to recover the initial outlay cost with the investments discounted cash flows. The lesser the time required to recover; the more desirable is the project. It is defined as:
Discounted Payback Period (in years) = Year before Full recovery + Unrecovered Cost at Start of Year /Discounted Cash Flow during Year
Assumption: The project’s net profit is equal to the project’s cash flows.
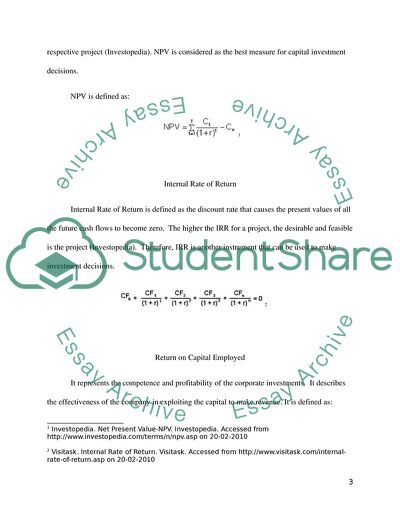
Net Present Value
Net Present Value is the difference between the present values of the cash inflows and outflows. It is calculated to decide on an investment decision as it shows the profitability of the respective project (Investopedia). NPV is considered as the best measure for capital investment decisions.
NPV is defined as:
1
Internal Rate of Return
Internal Rate of Return is defined as the discount rate that causes the present values of all the future cash flows to become zero. The higher the IRR for a project, the desirable and feasible is the project (Investopedia). Therefore, IRR is another instrument that can be used to make investment decisions.
2
Return on Capital Employed
It represents the competence and profitability of the corporate investments. It describes the effectiveness of the company in exploiting the capital to make revenue. It is defined as:
ROCE = {Net Profit +Interest (1- Tax Rate)}/ Average (Common Equity + Debt)
Profit and Loss Statements
The Profit and Loss statement show the profitability of the projects over a period of time. They have been prepared for the next years to ascertain the profitability of the both the projects. Keeping in mind the forecasted demand, the following Profit and Loss statements have been prepared. Since the tax rate was not specified, we have assumed a zero taxes.
ANALYSIS
For in depth understanding of both the proposal, a thorough analysis has been conducted. All values are in £’000.
Proposal 1:
Year 1
Year 2
Year 3
Year 4
Sales
1,200
1,400
2,400
900
Less: Variable Operating Costs
480
560
960
360
Less: Fixed Operating Costs
170
170
170
170
EBIT
550
670
1,270
370
Less: Interest Payments
3% Debentures
15
15
15
15
7% Loan Stock
35
35
35
35
50
50
50
50
Net Profit
500
620
1,220
320
Discounted Payback Period (in years) = 2.99 Years (Refer to Figure 1 in Appendix)
NPV = £249000 (Refer to Figure 3 in Appendix)
IRR = 12.3% (Refer to Figure 5 in Appendix)
ROCE (Refer to Figure 7 in Appendix)
Year 1
Year 2
Year 3
Year 4
ROCE
27.5%
33.5%
63.5%
18.5%
The first project, that is the launching of the new product JJ in the existing market, shows an increasing trend of sales over the first 3 years and then a slump in the fourth year. Therefore, the net profit shows a similar trend as well. The analysis show us that the project would be able to pay back the initial investment in approximately 3 years, taking into account the time value of money and hence, add value to the firm in the fourth year. At the same time, this project is feasible as it has a positive NPV of £249000. This means that the project is generating more cash than the amount invested in the project initially and the debt servicing. Indirectly this will increase the wealth of the company. The project has an IRR of 12.3% which is greater than the cost of borrowing. Hence, it increases the wealth of the company and the shareholders. On the other hand, the project will not be able to meet the targeted return on capital employed of 30%. It will not be able to generate enough cash with its investments in the 1st and the 4th year yet it gives a very high return of 63% in the third year.
Proposal 2
Year 1
Year 2
Year 3
Year 4
Sales
1,400
2,120
2,040
1,440
Less: Variable Operating Costs
560
848
816
576
Less: Fixed Operating Costs
170
170
170
170
EBIT
670
1,102
1,054
694
Less: Interest Payments
3% Debentures
15
15
15
15
7% Loan Stock
35
35
35
35
50
50
50
50
Net Profit
620
1,052
1,004
644
Discounted Payback Period (in years) = 2.61 Years (Refer to Figure 2 in Appendix)
NPV = £809000 (Refer to Figure 4 in Appendix)
IRR = 25.3% (Refer to Figure 6 in Appendix)
ROCE (Refer to Figure 8 in Appendix)
Year 1
Year 2
Year 3
Year 4
ROCE
33.5%
55.1%
52.7%
34.7%
The second project, that is the launch of the existing product GG in the new markets globally. The financial analysis shows an increasing trend of forecasted sales with a small slump in the last year. Hence, the project portrays more consistent sales over the life of the project. The project has a payback period of 2.61 years taking into account the time value of money and will result in generating more cash than the initial investment done. Further in depth analysis show us that the project has a high positive NPV of £809000. The project will add value to the firm and increase the wealth of the shareholders. At the same time, it has a very high internal rate of return of 25.3%. Hence, the shareholders wealth is maximized. On the other hand, the project also meets the target return on the capital employed of 30% each year with the highest return of 55.1% in the second year.
COMPARISON BETWEEN THE TWO PROPOSALS
We have analyzed the proposals at two different levels:
Economic Feasibility: This will determine the contribution of the proposals in the long run profitability of the company.
Financial feasibility: This will determine the cash flows and their adequacy to make the necessary costs of borrowings.
Independently both the proposals are financial sound and economically feasible and add value to the company in the long run. But at the same time, Proposal 2 appears to be more financially sound as compared to Proposal 1. Proposal 2 provided the company with a higher amount of cash flows over the life of the project. Hence, it results in a higher net present value and an addition of £560000 to the wealth of the shareholders. Next, proposal 2 gives a higher internal rate of return of 25.3%. It also meets the targeted annually ROCE and hence ensures the firm’s efficiency to generate revenue from the invested capital. The proposal 2 also takes a lesser time to payback the initial investment as compared to counterpart. Therefore, proposal 2 should be given go ahead amongst the two options.
There are many other financial factors that were put forward in considering the best alternative amongst the two proposals. The discount rate is very significant for making capital investment decisions. Basically, this is considered that minimum acceptable rate of return of the project. At the same time, riskiness and accuracy of the forecasted cash flows have to be analyzed because these cash flows form the basis of all financial measures. Hence, any problem in the cash flows would invalidate the profitability of the project. At the same, the foreign risk need to taken into effect. Any change in the foreign exchange rate between the overseas countries will considerably change the cash flows of the project and hence affect the financial measures. On the other hand, the political stability, economic factors, and tax incentives need to be focused on if proposal 2 is to be moved ahead.
NON-FINANCIAL IMPLICATIONS
An effective launch plan is very significant for the new product launch. It needs to well planned and well documented for the success of the new product in the existing market or a new undiscovered market (DRM Associates, 2002).
The launch new product JJ in the existing market shows strong potential. The firm already has an established name in the existing market and therefore it is most likely to face similar reaction to the new product. At the same time, the product has been tested in different geographical regions in the existing market and has received positive response. Therefore, there is a strong chance that the product will be successful and will generate the expected cash flows.
On the other, the launch of the existing product GG in the new market overseas has huge prospects. There is an entire new market to tap but the introduction can be faced by severe competition from the local firms. The marketing report from one of our established distributor has provided a go ahead and hence, we have a strong belief that the product would be success. The new market has been properly analyzed and the product has been tested in the new market. Therefore, we have a strong reason to believe that the project will generate the expected profits and add value to the firm.
Both the proposals have positive non-financial implications.
CONCLUSION
We strongly believe that Proposal 2: Launch of the Existing Product GG in the new market overseas must be carried on and implemented. The proposal shows strong financial prospects as well as non-financial implications. It is more consistent in terms of the returns over the life of the project with a high internal rate of return.
APPENDIX
(All Values are in £'000)
DISCOUNTED PAYBACK PERIOD
Proposal 1
Figure 1
Year 0
Year 1
Year 2
Year 3
Year 4
Cash Flows
(2,000)
500
620
1,220
320
Discounted Cash Flows
(2,000)
467
542
996
244
Cumulative DCF
(2,000)
(1,533)
(991)
5
249
Discounted Payback Formula:
Discounted Payback Period (in years) = Year before Full recovery + Unrecovered Cost at Start of Year /Discounted Cash Flow during Year
Discounted Payback Period (in years) = 2 + (991/996)
Discounted Payback Period (in years) = 2.99 Years
Proposal 2
Figure 2
Year 0
Year 1
Year 2
Year 3
Year 4
Cash Flows
(2,000)
620
1,052
1,004
644
Discounted Cash Flows
(2,000)
579
919
820
491
Cumulative DCF
(2,000)
(1,421)
(502)
318
809
Discounted Payback Formula:
Discounted Payback Period (in years) = Year before Full recovery + Unrecovered Cost at Start of Year /Discounted Cash Flow during Year
Discounted Payback Period (in years) = 2 + (502/820)
Discounted Payback Period (in years) = 2.61 Years
NET PRESENT VALUE
Discount rate has been taken as the cost of equity as the cash flow is only available to the company’s shareholders. The discount rate is 7%.
Proposal 1
Figure 3
Year 0
Year 1
Year 2
Year 3
Year 4
Cash Flows
(2,000)
500
620
1,220
320
PVIF
1.0000
0.9346
0.8734
0.8163
0.7629
PV of Cash Flows
(2,000)
467
542
996
244
`
NPV = (2000) + 467 + 542 + 996 + 244
NPV = 249
Proposal 2
Figure 4
Year 0
Year 1
Year 2
Year 3
Year 4
Cash Flows
(2,000)
620
1,052
1,004
644
PVIF
1.0000
0.9346
0.8734
0.8163
0.7629
PV of Cash Flows
(2,000)
579
919
820
491
NPV = (2000) + 579 + 919 + 820 + 491
NPV = 809
INTERNAL RATE OF RETURN
Proposal 1
Figure 5
Year 0
Year 1
Year 2
Year 3
Year 4
Cash Flows
(2,000)
500
620
1,220
320
PVIF
1.0000
0.8906
0.7931
0.7063
0.6290
PV of Cash Flows
(2,000)
445
492
862
201
NPV
(0)
Using Excel, we found that
IRR = 12.3%
Proposal 2
Figure 6
Year 0
Year 1
Year 2
Year 3
Year 4
Cash Flows
(2,000)
620
1,052
1,004
644
PVIF
1.0000
0.8095
0.6553
0.5305
0.4294
PV of Cash Flows
(2,000)
502
689
533
277
NPV
0
Using Excel, we found that
IRR = 25.3%
RETURN ON CAPITAL EMPLOYED
Proposal 1
Figure 7
Year 1
Year 2
Year 3
Year 4
Net Profit + Interest
550
670
1,270
370
Average (Common Equity + Debt)
2000
2000
2000
2000
ROCE
27.5%
33.5%
63.5%
18.5%
Proposal 2
Figure 8
Year 1
Year 2
Year 3
Year 4
Net Profit + Interest
670
1,102
1,054
694
Average (Common Equity + Debt)
2000
2000
2000
2000
ROCE
33.5%
55.1%
52.7%
34.7%
BIBLIOGRAPHY
Brealey, R. A. (2007). Principles of Corporate Finance. McGraw-Hill.
Brigham, E. F. (2008) Financial Management: Theory and Practice. Thomson Learning
Dayananda, D. (2002) Capital budgeting: financial appraisal of investment projects. Amazon
Horne, J. C. V. (2005) Fundamentals of Financial Management.
MacDonald, M. (2006) Excel 2007: The Missing Manual. Amazon
Megginson, W. L. (2008) Introduction to Corporate Finance. Patrick Bond
Ross, S. A. (2004) Corporate Finance. McGraw-Hill
DRM Associates. (2002). Product Launch Process. New Product Development Solutions. Accessed from http://www.npd-solutions.com/launchcons.html on 21-02-2010
Investopedia. Internal Rate of Return-IRR. Investopedia. Accessed from http://www.investopedia.com/terms/i/irr.asp on 20-02-2010
Investopedia. Net Present Value-NPV. Investopedia. Accessed from http://www.investopedia.com/terms/n/npv.asp on 20-02-2010
Investopedia. Return on Capital Employed-ROCE. Investopedia. Acessed from http://www.investopedia.com/terms/r/roce.asp on 20-02-2010
NetMBA. Capital Budgeting. NetMBA: Business Knowledge Centre. Accessed from http://www.netmba.com/finance/capital/budgeting/ on 20-02-2010
Visitask. Internal Rate of Return. Visitask. Accessed from http://www.visitask.com/internal-rate-of-return.asp on 20-02-2010
Read
More
sponsored ads
Save Your Time for More Important Things
Let us write or edit the assignment on your topic
"Financial Management Measures - Discounted Payback Period"
with a personal 20% discount.
GRAB THE BEST PAPER
