StudentShare

Our website is a unique platform where students can share their papers in a matter of giving an example of the work to be done. If you find papers
matching your topic, you may use them only as an example of work. This is 100% legal. You may not submit downloaded papers as your own, that is cheating. Also you
should remember, that this work was alredy submitted once by a student who originally wrote it.
✕
Free
Profitability, Liquidity, Asset Management, and Long-Term Solvency Ratios for Gillette Company - Case Study Example
Summary
The paper "Profitability, Liquidity, Asset Management, and Long-Term Solvency Ratios for Gillette Company" is a brilliant example of a case study on finance and accounting. As the paper outlines, Gillette Company is a large manufacturer of personal care products. The company was found in 1901 and was merged into Procter & Gamble in 2005…
- Subject: Finance & Accounting
- Type: Case Study
- Level: Undergraduate
- Pages: 5 (1250 words)
- Downloads: 0
- Author: estrella63
Extract of sample "Profitability, Liquidity, Asset Management, and Long-Term Solvency Ratios for Gillette Company"
Finance and Accounting Introduction Gillette Company is large manufacturer of personal care products. The company was found in 1901 and was merged into Procter & Gamble in 2005. This report aims to evaluate the financial health of Gillette based on the information presented in the financial report for the FY 2003 (before its acquisition by P&G). For this analysis there will be employed financial ratios calculation and interpretation method.
1. Calculation of the profitability, liquidity, asset management, and long term solvency ratios for Gillette Company
While analysing a financial performance and health of the company, there are used financial ratios. Financial ratios are differentiated by several categories, including: profitability, liquidity, efficiency, and financial gearing (Atrill and McLaney, 2011). For calculating the financial ratios for the Gillette Company there were used the following financial statements published in 2003: consolidated balance sheet, consolidated statement of earnings, and consolidated statement of cash flow.
Profitability ratios
Profitability ratios help an analyst or any other user of the company’s financial statements to evaluate the success of the business in terms of profit generation. For calculating profitability, there can be used the following ratios: return on equity (ROE), return on assets (ROA), return on invested capital; net profit margin (Atrill and McLaney, 2011).
Return on equity (ROE)=Net income/stockholders’ Equity = $1,385/$2,224=62.3%;
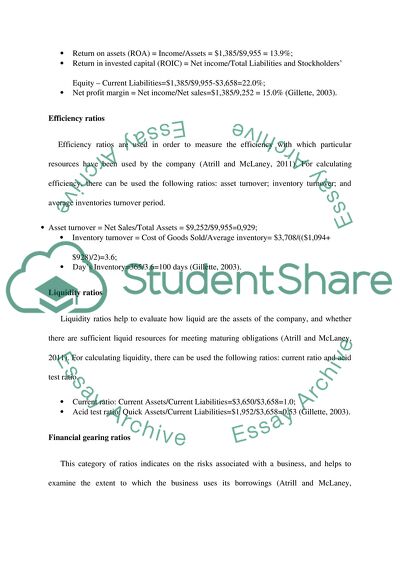
Return on assets (ROA) = Income/Assets = $1,385/$9,955 = 13.9%;
Return in invested capital (ROIC) = Net income/Total Liabilities and Stockholders’ Equity – Current Liabilities=$1,385/$9,955-$3,658=22.0%;
Net profit margin = Net income/Net sales=$1,385/9,252 = 15.0% (Gillette, 2003).
Efficiency ratios
Efficiency ratios are used in order to measure the efficiency with which particular resources have been used by the company (Atrill and McLaney, 2011). For calculating efficiency, there can be used the following ratios: asset turnover; inventory turnover; and average inventories turnover period.
Asset turnover = Net Sales/Total Assets = $9,252/$9,955=0,929;
Inventory turnover = Cost of Goods Sold/Average inventory= $3,708/(($1,094+$928)/2)=3.6;
Day’s Inventory=365/3.6=100 days (Gillette, 2003).
Liquidity ratios
Liquidity ratios help to evaluate how liquid are the assets of the company, and whether there are sufficient liquid resources for meeting maturing obligations (Atrill and McLaney, 2011). For calculating liquidity, there can be used the following ratios: current ratio and acid test ratio.
Current ratio: Current Assets/Current Liabilities=$3,650/$3,658=1.0;
Acid test ratio: Quick Assets/Current Liabilities=$1,952/$3,658=0.53 (Gillette, 2003).
Financial gearing ratios
This category of ratios indicates on the risks associated with a business, and helps to examine the extent to which the business uses its borrowings (Atrill and McLaney, 2011:188). For calculating gearing ratio, there can be used the following ratios: the debt-to-equity ratio, times interest earned, equity ratio (Dyson, 2010; Atrill and McLaney, 2011).
The debt-to-equity ratio = Total Liabilities/Owner’s Equity=$9,955-$2,224/$2,224=3.5
Times interest earned = Pretax Operating income + Interest Expense/Interest=%1,964+$54/$54=37.4x;
Dividend Yield = Dividends per Share/Market price per share = $0.65/$34.00=1.9% (Gillette, 2003).
2. Analysis of the Gillette Company’s financial position and performance
Profitability ratios have shown that the company has high ROE, which means that it returns 62% of the net income as a percentage of shareholders equity. In other words, the Gillette has generated $0.60 of profit for every $1 of shareholders’ equity in FY 2003 (Dyson, 2010; Atrill and McLaney, 2011). Return on Assets of Gillette in 2003 indicates that the company is managing a company quite effectively as for every dollar the shareholders invested in assets the company produced $0, 13 of net income. ROIC and net profit margin ratios calculated only for one year period do not provide sufficient enough information in order to draw conclusions (Atrill and McLaney, 2011).
Efficiency ratios calculated above indicate that Gillette has a very high asset turnover capability. The asset turnover is close to 1 which means that the net sales of Gillette equals the average total assets for the year. Therefore, Gillette generated $0.93 of sales for every dollar invested in assets in FY 2003 (Dyson, 2010). Inventory turnover calculated above shows indicates that Gillette managed its inventory in very efficient way, selling 3.6 times its inventory during 2013 (Jones, Atkinson and Lorenz, 2012).
Liquidity ratios have shown to what extent the company’s assets are easily convertible into cash. Current ratio of 1 indicates that Gillette is in favourable position in terms of liquidity as its current liabilities could be covered by the current assets (Dyson, 2010). In such a position the company is more likely to obtain a loan from the bank or other creditor. On the other hand, Gillette has a quick ratio of 0.53, which indicated that the company has half of the quick assets for covering its current liabilities (Jones, Atkinson and Lorenz, 2012). It means that the company might have difficulties with paying off its obligations (Dyson, 2010).
Financial gearing ratios have helped to evaluate the extent to which Gillette uses its borrowings (Atrill and McLaney, 2008). The debt-to-equity ratio of Gillette is 3.5, which means that the assets of the company are heavily funded by creditors. It indicates that the company is in risky position, as the company is dependent on creditors and is obliged to pay off debt and interest rate payments. However, with higher risks the returns to owners also can be higher (Jones, Atkinson and Lorenz, 2012). Gillette’s relatively high times interest earned indicates that the company generates enough income in order to pay out its total interest expense (Atrill and McLaney, 2008). Dividend Yield is relatively low and means that the company doesn’t generate high returns. On the other hand, this low ratio can be viewed as an indicator of Gillette’s financial stability and investment safety.
3. Additional information required for better analysis of the Gillette’s financial statements
For analysing the company’s financial performance use of financial ratios is a right decision, as these indicators help to assess the company’s financial health. However, financial ratios as they are, can hardly be very useful without comparative analysis (Atrill and McLaney, 2011; Jones, Atkinson and Lorenz, 2012). Ideally, financial ratios should be compared with the financial ratios of the past years. This additional information will help users of Gillettes’ financial report to draw a bigger picture, to analyse major trends and tendencies, and to detect any deterioration or improvement in Gillette’s financial condition and performance (Van Horne & Machowicz, 2008). In addition to comparing financial ratios for FY 2013 it might be very helpful to compare the Gillette’s financial ratios with the financial ratios of its key competitors/similar businesses (Atrill and McLaney, 2006). This comparative analysis will help a users to understand how well Gillette performs against its competitors. Another source of useful information would be average industry financial ratios. Comparing the Gillettes’ financial ratios with the average industry indicators also will add value to the analysis, as the users will be able to benchmark Gillettes’ performance against industry indicators. This information is especially useful as ratios for the companies operating in different industries can be extremely contrasting. Also, it might be very helpful to carry out external environment analysis in order to understand various external factors which might have had direct or indirect impact on the Gillette’s performance in 2003.
4. The major risks and advantages/opportunities for Gillette
As the company operated also outside the US, it was facing with the relevant risks, such as: changes in foreign exchange rates; changes in regulatory taxation requirements or tax laws; trade protection measures; changes in economic or political conditions, etc. (Gillette, 2003). Dependence of the company upon key retailers also could place the company into risky positon as a result of growing bargaining power of retailers. Aggressive competition was another substantial challenge for Gillette as the company could lose its market share, and this would more likely have negative effect on financial position of the company (Gillette, 2003).
However, in addition to the above mentioned risks, Gillette also had some opportunities for business growth and development. Thus, for example, growing demand for the oral cate products in the global scales could be a great opportunity for developing this specific segment in global scales (Gillette, 2003). Gillette also had some obvious business advantages, contributing to the company’s competitive positioning strategy and offering greater opportunities. As of 2003, some of these advantages were: brand recognition, strong and effective marketing function, powerful research and development (R&D) process, etc. (Gillette, 2003).
References:
Atrill, P. and McLaney, E. (2006). Accounting and finance for non-specialists. Harlow: Financial Times Prentice Hall.
Atrill, P. and McLaney, E. (2008). Financial accounting for decision makers. Harlow: Financial Times Prentice Hall.
Atrill, P. and McLaney, E. (2011). Accounting and finance for non-specialists. Harlow: Financial Times/Prentice Hall.
Gillette, (2003). 2003 Annual Report.
Investopedia, (2003). Gearing Ratio Definition, Investopedia. [online] Available at: http://www.investopedia.com/terms/g/gearingratio.asp
Investinganswers.com, (n.d.). Return on Equity (ROE) Definition & Example | Investing Answers. [online] Available at: http://www.investinganswers.com/financial-dictionary/financial-statement-analysis/return-equity-roe-916
Jones, T., Atkinson, H. and Lorenz, A. (2012). Strategic managerial accounting. Oxford: Goodfellow Publishers.
Dyson, J. (2010). Accounting for non-accounting students. Harlow, UK: Financial Times Prentice Hall.
My Accounting Course, (n.d.). Times Interest Earned Ratio. [online] Available at: http://www.myaccountingcourse.com/financial-ratios/times-interest-earned-ratio
Van Horne, J. and Machowicz, J. (2008). Van Horne: Fundamentals of Financial Management. Pearson Education.
Read
More
sponsored ads
Save Your Time for More Important Things
Let us write or edit the case study on your topic
"Profitability, Liquidity, Asset Management, and Long-Term Solvency Ratios for Gillette Company"
with a personal 20% discount.
GRAB THE BEST PAPER
