StudentShare
Contact Us
Sign In / Sign Up for FREE
Search
Go to advanced search...
Free

Statistical Analysis and Interpretation for Etisalat Telecom Corporation - Essay Example

Cite this document
Summary
This paper "Statistical Analysis and Interpretation for Etisalat Telecom Corporation" presents the results of the analysis of data based on the responses collected from a number of respondents. The analysis is based on a total of 826 questionnaire responses received…
Download full paper File format: .doc, available for editing
GRAB THE BEST PAPER92.3% of users find it useful
Statistical Analysis and Interpretation for Etisalat Telecom Corporation
Read Text Preview

Extract of sample "Statistical Analysis and Interpretation for Etisalat Telecom Corporation"

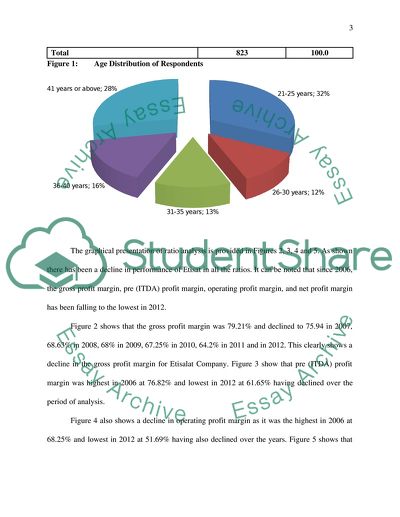
Research Findings, Statistical Analysis and interpretation for Etisalat Telecom Corporation My Introduction This paper presents the results of the analysis of data based on the responses collected from a number of respondents. The analysis is based on a total of 826 questionnaire responses received. The 668 questionnaires were received for sections A and B of the questionnaire while 158 responses were received for section C. The analysis was carried out using SPSS version 20. The results are presented as follows: first, the descriptive results are shown in graphs and tables. This is done through description of results of the study where the frequencies, trends, mean, min, max, standard deviation results are shown and discussed. Next is the presentation of results of reliability analysis are presented for all the items used in the questionnaire and for each item used in the questionnaire. The third section presents the results of correlation analysis using graphs where the performance data is graphically presented on their associations. The last section presents the results of hypotheses tests using one-sample t-tests. Descriptive Analysis Table 1 shows the age distribution of the respondents. As shown, the results show that 34% of the respondents were aged 21-25 years, 11% were aged 26-30 years, 13% were aged 31-35 years, 16% were aged 36-40 years, and 28% were aged 41 years or above. Thus most of the respondents were aged 21-25 and above 40 years. These results are also presented in Figure 1. Table 1: Age Distribution of Respondents Age Group in years Frequency Percent 21-25 262 34 26-30 96 11 31-35 108 13 36-40 129 16 41 or above 228 28 Total 823 100.0 Figure 1: Age Distribution of Respondents The graphical presentation of ratio analysis is provided in Figures 2, 3, 4 and 5. As shown there has been a decline in performance of Etisat in all the ratios. It can be noted that since 2006, the gross profit margin, pre (ITDA) profit margin, operating profit margin, and net profit margin has been falling to the lowest in 2012. Figure 2 shows that the gross profit margin was 79.21% and declined to 75.94 in 2007, 68.63% in 2008, 68% in 2009, 67.25% in 2010, 64.2% in 2011 and in 2012. This clearly shows a decline in the gross profit margin for Etisalat Company. Figure 3 show that pre (ITDA) profit margin was highest in 2006 at 76.82% and lowest in 2012 at 61.65% having declined over the period of analysis. Figure 4 also shows a decline in operating profit margin as it was the highest in 2006 at 68.25% and lowest in 2012 at 51.69% having also declined over the years. Figure 5 shows that the net profit margin was highest in 2006 at 35.97% and lowest in 2012 at 26.92%. This shows a decline of operating profit margin over the period of analysis. Figure 2: Trend of Gross Profit Margin Figure 3: Trend of Pre (ITDA) Profit Margin Figure 4: Operating Profit Margin Trend Figure 5: Net Profit Margin Trend Table 2: Descriptive Results Statement N Mean Stdev. 1. Etisalat improved its services last 3 years 665 3.6466 1.14463 2. Has the overall price of Etisalat telecom services come down during the last three years? 646 4.1486 1.10331 3. Has the management of Etisalat adopted the right strategy by outsourcing IT? 665 3.2887 1.45648 4. Does Etisalat adopted many successful IT outsourcing models into mobile application 659 3.5690 1.27735 5. Do you think Etisalat can offer different technologies through IT outsourcing? 665 3.6195 1.26035 6. Is clarity of calls improved? 647 4.0448 1.46531 7. Do you believe that IT outsourcing can positively impact on firm cost reduction? 665 3.3895 1.40574 8. Do you think that Etisalat could gain better results in term of customers, revenues and reputation, if they keep using strategic frameworks of IT outsourcing 665 3.5985 1.31133 9. Billing methods are transparent & support Sustainability 646 3.8653 1.00351 10. Does Etisalat adopted Sustainability as green IT 665 3.9293 1.10426 11. Retail outlets are available in enough numbers and are easily accessible 646 3.9396 1.32587 12. Do you think Etisalat can be differentiate from competitors in the telecom marketplace in UAE 668 3.7365 1.32649 13. Etisalat differentiate itself from the competition by offering new sustainable applications technology 663 3.7454 1.04151 14. Etisalat plans to differentiate themselves in a sustainable and cost effective manner, 158 3.9452 1.21454 15. Service are delivered promptly 656 3.7409 0.85298 16. Has customer service improved in Etisalat? 546 4.1465 1.09477 17. Has the service or quality of Etisalat improved due to IT outsourcing? 665 3.3534 1.43323 18. Has the management of Etisalat adopted the right strategy by outsourcing IT 158 3.8987 0.75873 19. Can IT outsourcing be considered a key asset in the business of Etisalat 158 3.9241 0.72748 20. Does IT outsourcing helps Etisalat to provide significant contribution on perceived customer benefits. 158 4.0633 1.39872 21. Has the management of Etisalat focus on their core competencies due to IT outsourcing 158 3.4684 1.30492 22. IT outsourcing facilitates Etisalat to get qualified workers from IT vendor 158 3.9873 1.44492 23. IT outsourcing enables Etisalat to transfer its fixed cost to variable cost. 158 4.0506 1.16425 24. Has IT outsourcing been able to reduce costs for Etisalat 158 3.7089 1.07255 25. Tangible Cost Saving Achieved Through Outsourcing 158 3.9557 1.14037 26. Has Outsourcing of IT increased profitability in business of Etisalat 158 3.7532 1.03251 27. IT outsourcing enables Etisalat to obtain skilled labour at a lower cost. 158 4.038 1.33865 28. Has IT Outsourcing contributed to growth of Etisalat 158 4.0190 0.56963 29. Has the services or quality of Etisalat improved due to IT outsourcing 158 3.9430 0.41074 30. Has Etisalat gained competitive market advantage due to IT outsourcing 158 4.0316 0.17561 31. Does Etisalat adopted Sustainability as green IT 158 4.0000 0.00000 32. Has the business of Etisalat lost sustainability due to IT outsourcing 158 2.7785 0.52484 Table 2 shows the descriptive results for all the 30 items used in the study. As shown, the results are presented for the number of respondents for each item, the maximum scores, the mean and the standard deviations. To interpret the results, it is important to understand that the scale for each of the responses ranged from 1-5 with 1 suggesting no agreement and 5 suggesting most agreement. Therefore, the mean values of 3 or above suggest that the respondents were in agreement with the statement as given while those below 3 suggest a rejection of the statements. The results show that the service of the company had improved in the last three years as shown by the mean of 3.6. The company had also adopted sustainability as green IT (mean = 3.9), IT outsourcing is considered a key asset (mean = 3.9), outsourcing had contributed to growth (mean = 4.01) and gained competitive advantage (mean = 4.03). Validity and Reliability Test It is usually important that questionnaire reliability is established before an analysis is run and the results presented as it shows whether the instrument was reliable enough to enable generalisation of results as well as authenticity in making conclusions from the study. A number of methods exist for measuring questionnaire reliability but the most common method used is the Cronbach’s alpha. The Cronbach’s alpha was been used to test the questionnaire reliability in this paper. The test statistic is 0.872 for all the 30 items used in the questionnaire. This shows a very high reliability of the instrument. Item analysis reliability was also performed to test if some variables could be removed to improve the reliability. The results in Table 1 show that none of the items in the questionnaire had a low reliability and therefore there was no need to remove any of the items in the questionnaire for final analysis to improve the scale reliability. All the 30 items are therefore used in the analysis. Table 3: Item Reliability Analysis Scale Mean if Item Deleted Scale Variance if Item Deleted Corrected Item-Total Correlation Cronbachs Alpha if Item Deleted 1. Etisalat improved its services last 3 years 77.4430 31.166 .784 .858 2. Has the overall price of Etisalat telecom services come down during the last three years? 77.4120 30.415 .775 .861 3. Has the management of Etisalat adopted the right strategy by outsourcing IT? 77.3101 32.674 .766 .864 4. Does Etisalat adopted many successful IT outsourcing models into mobile application 77.2595 34.461 .317 .873 5. Do you think Etisalat can offer different technologies through IT outsourcing? 77.2532 34.764 .000 .874 6. Is clarity of calls improved? 77.2546 34.475 .001 .872 7. Do you believe that IT outsourcing can positively impact on firm cost reduction? 77.2722 33.881 .542 .870 8. Do you think that Etisalat could gain better results in term of customers, revenues and reputation, if they keep using strategic frameworks of IT outsourcing 77.2532 34.764 .000 .874 9. Billing methods are transparent & support Sustainability 77.2532 34.761 .000 .873 10. Does Etisalat adopted Sustainability as green IT 77.2532 34.764 .000 .874 11. Retail outlets are available in enough numbers and are easily accessible 77.2532 34.764 .000 .874 12. Do you think Etisalat can be differentiate from competitors in the telecom marketplace in UAE 77.2532 34.764 .000 .874 13. Service are delivered promptly 77.2532 34.764 .000 .874 14. Has customer service improved in Etisalat? 77.2532 34.764 .000 .874 15. Has the service or quality of Etisalat improved due to IT outsourcing? 77.2532 34.764 .000 .874 16. Etisalat differentiate itself from the competition by offering new sustainable applications technology 77.2532 34.764 .000 .874 17. Has the management of Etisalat adopted the right strategy by outsourcing IT 78.3544 27.759 .804 .850 18. Can IT outsourcing be considered a key asset in the business of Etisalat 78.3291 28.133 .791 .851 19. Does IT outsourcing helps Etisalat to provide significant contribution on perceived customer benefits 78.3281 27.251 .645 .764 20. Etisalat plans to differentiate themselves in a sustainable and cost effective manner, 78.7848 25.254 .594 .764 21. Has the management of Etisalat focus on their core competencies due to IT outsourcing 78.7848 25.253 .595 .876 22. IT outsourcing facilitates Etisalat to get qualified workers from IT vendor 78.6412 25.124 .594 .865 23. IT outsourcing enables Etisalat to transfer its fixed cost to variable cost. 78.6012 25.214 .591 .854 24. Has IT outsourcing been able to reduce costs for Etisalat 78.5443 24.402 .869 .846 25. Tangible Cost Saving Achieved Through Outsourcing 78.5123 24.301 .871 .845 26. Has Outsourcing of IT increased profitability in business of Etisalat 78.5000 24.659 .881 .844 27. IT outsourcing enables Etisalat to obtain skilled labour at a lower cost. 78.4125 25.214 .748 .745 28. Has IT Outsourcing contributed to growth of Etisalat 78.2342 30.206 .676 .858 29. Has the services or quality of Etisalat improved due to IT outsourcing 78.3101 32.228 .508 .865 30. Has Etisalat gained competitive market advantage due to IT outsourcing 78.2215 34.237 .241 .872 31. Does Etisalat adopted Sustainability as green IT 78.2532 34.764 .000 .874 32. Has the business of Etisalat lost sustainability due to IT outsourcing 79.4747 29.397 .894 .851 Correlational Analysis: a Graphical Analysis Given that the data points were few (only 7 points), the correlation analysis is performaed graphically to identify the monotonic relationship between the variables. In this paper, such a relationship was tested using scatter plots of two variables at a time. As shown in Figure 6, 7, 8, 9, 10, and 11, there was a monotonic relationship between the variables of interest in the study. Figure 6 show a positive relationship between gross profit margin and pre profit margin. Figure 7 show a positive relationship between gross profit margin and operating profit margin. Figure 8 show a positive relationship between gross profit margin and net profit margin. Figure 9 show a positive relationship between operating profit margin and pre profit margin. Figure 10 show a positive relationship between net profit margin and pre profit margin. Figure 11 show a positive relationship between operating profit margin and net profit margin. Figure 6: Relationship between Gross Profit Margin and Pre (ITDA) Profit Margin Figure 7: Relationship between Gross Profit Margin and Operating Profit Margin Figure 8: Relationship between Gross Profit Margin and Net Profit Margin Figure 9: Relationship between Pre Profit Margin and Operating Profit Margin Figure 10: Relationship between Pre Profit Margin and Net Profit Margin Figure 11: Relationship Operating Profit Margin and Net Profit Margin Hypotheses Tests using One-Sample T-Tests The study carried out t-tests using specific variables related to the hypotheses. This method was resorted to because of the fact that the data did not meet all the requirements of an OLS regression analysis and therefore the normal regression statistics could not be run on the data. The study has used the one-sample t-test method to test whether IT outsourcing affected a number of performance outcomes in the organisation. A one sample t-test allows us to test whether a sample mean (of a normally distributed interval variable) significantly differs from a hypothesized value. To carry out a one-sample t-test, it is required that a test value be used. The questionnaire for gathering data for Etisalat used in this study was conducted on a 5 point Likert scale ranging from ‘don’t know’ to ‘strongly agree’. This was coded into the SPSS as follows: 1= Don’t Know; 2= Strongly Disagree; 3= Disagree; 4= Agree; and 5 = Strongly Agree. Therefore, a test value a t-test analysis needed to be selected based on the scale above. Since values of 1, 2 and 3 all denote a disagreement with the statements provided while values 4 and 5 denote an agreement, I chose a value of 3 as a test value for running the one-sample t-test. Since the t-tests are based on examining mean differences, this therefore means that when a statement scores a mean below 3 or above 3, the differences are tested for significance or not and interpreted as in the tables below. For interpretation of whether the differences in mean are significantly different from the test value of 3, researchers use a significance level. This can be 90%, 95% or 99% confidence level. When results are interpreted on a 90% confidence level, what that means is that the researcher is 90% confident that the differences are significant. For most researchers, a confidence level of 95% is usually desired. Therefore, the t-test interpretations in this paper are on a 95% level of confidence. In the tables therefore, Sig.(2-tailed) column is the confidence level column, also called the p-value. Thus we are looking at p-values that are 0.05 (5%) or less in order to say that the mean differences are statistically significant and therefore the relationship between dependent and independent variables exist. 5% or 0.05 is the difference between 95% and 100%. One-Sample T-Test for IT Outsourcing and Operational Performance The first hypothesis tested was that IT outsourcing in the company had led to improved operational performance. The results in Table 4 show that the mean difference for the statement “Has the service or quality of Etisalat improved due to IT outsourcing?” was 0.35338 higher than 3 (for disagree). This difference was significantly different from the test value of 3 as the p value is less than 0.05, p-value = 0.000. The null hypothesis is therefore rejected. The second statement “Etisalat improved its services last 3 years” also shows that the mean difference is 0.64662 and is statistically significant from the test value of 3. Therefore, the null hypothesis on this too is rejected. This therefore suggests that IT outsourcing had a significant effect on service quality of the organisation. Thus, the more outsourcing is done the better the operational performance of the company. Therefore, the service quality has improved in the last three years and the quality improvement can be attributed to IT outsourcing strategy. Table 4: One Sample T-Test on IT Outsourcing and Operational Performance for all respondents t df Sig. (2-tailed) Mean Difference 95% Confidence Interval of the Difference Lower Upper Has the service or quality of Etisalat improved due to IT outsourcing? 6.358 664 .000 .35338 .2443 .4625 Etisalat improved its services last 3 years 14.568 664 .000 .64662 .5595 .7338 One-sample T-Test for IT Outsourcing and Profitability The second hypothesis tested related outsourcing and profitability of the company. This is also interpreted just the same way as in Table 4 above. The results in Table 5, 6, 7 and 8 shows that the mean was significantly different from the test value of 3 as the p value is less than 0.05 for both questions posed to the respondents in all the three groups studied. The null hypothesis is therefore rejected. This therefore suggests that IT outsourcing had a significant effect on the profitability of the organisation. Thus, the more outsourcing is done the better the profitability of the company by reducing costs and increased profitability. Table 5: One-sample T-Test for IT Outsourcing and Profitability for all Group t df Sig. (2-tailed) Mean Difference 95% Confidence Interval of the Difference Lower Upper Has Outsourcing of IT increased profitability in business of Etisalat 9.169 157 .000 .75316 .5909 .9154 Do you believe that IT outsourcing can positively impact on firm cost reduction? 7.145 664 .000 .38947 .2824 .4965 Table 6: One-sample T-Test for IT Outsourcing and Profitability for Group A t df Sig. (2-tailed) Mean Difference 95% Confidence Interval of the Difference Lower Upper Do you believe that IT outsourcing can positively impact on firm cost reduction? 4.145 224 .000 .62547 .2954 .4245 Table 7: One-sample T-Test for IT Outsourcing and Profitability for Group B t df Sig. (2-tailed) Mean Difference 95% Confidence Interval of the Difference Lower Upper Do you believe that IT outsourcing can positively impact on firm cost reduction? 8.145 521 .000 .24153 .2035 .2156 Table 8: One-sample T-Test for IT Outsourcing and Profitability for Group C t df Sig. (2-tailed) Mean Difference 95% Confidence Interval of the Difference Lower Upper Has IT outsourcing been able to reduce costs for Etisalat 6.169 139 .000 .44516 .23509 .94125 One-sample T-Test for IT Outsourcing and Sustainability The third hypothesis tested was the relationship between outsourcing and sustainability. Just like in Table 4, the interpretation and tests are based on the test value of 3. The results in Table 9, 10 and 11 shows that the mean was significantly different from the test value of 3 as the p value is less than 0.05 for all the questions posed to the three groups of respondents. The null hypothesis is therefore rejected. This therefore suggests that IT outsourcing had a significant effect on sustainability of the company. Thus, the more outsourcing is done the better the sustainability of the company. Table 9: One-sample T-Test for IT Outsourcing and Sustainability for All Group t df Sig. (2-tailed) Mean Difference 95% Confidence Interval of the Difference Lower Upper Does Etisalat adopted Sustainability as green IT 21.702 664 .000 .92932 .8452 1.0134 Billing methods are transparent and support sustainability 12.4516 512 .000 .6894 2.1452 6.2145 Table 10: One-sample T-Test for IT Outsourcing and Sustainability for Group A t df Sig. (2-tailed) Mean Difference 95% Confidence Interval of the Difference Lower Upper Does Etisalat adopted Sustainability as green IT 11.602 554 .000 .9354 .8215 1.7451 Billing methods are transparent and support sustainability 15.4415 610 .000 .6954 2.2145 7.214 Table 11: One-sample T-Test for IT Outsourcing and Sustainability for Group B t df Sig. (2-tailed) Mean Difference 95% Confidence Interval of the Difference Lower Upper Does Etisalat adopted Sustainability as green IT 21.442 544 .000 .9742 .8978 8.4526 Billing methods are transparent and support sustainability 12.4745 510 .000 .7894 5.1423 9.124 One-sample T-Test for IT Sustainability and Differentiation The fourth hypothesis was tested on the relationship between sustainability and differentiation. Just as above, the results are based on the test value of 3 and the differences above this mean value of 3 are tested for significance. The results in Table 12 and13 show that the mean was significantly different from the test value of 3 as the p value is less than 0.05. The null hypothesis is therefore rejected. This therefore suggests that sustainability affected differentiation. Thus, the more sustainable the company is the more it is differentiated. Table 12: One-sample T-Test for Sustainability and Differentiation for All Group t df Sig. (2-tailed) Mean Difference 95% Confidence Interval of the Difference Lower Upper Etisalat differentiate itself from the competition by offering new sustainable applications technology 12.676 664 .000 .61955 .5236 .7155 Table 13: One-sample T-Test for Sustainability and Differentiation for Group C Test Value = 3 t df Sig. (2-tailed) Mean Difference 95% Confidence Interval of the Difference Lower Upper Etisalat plans to differentiate themselves in a sustainable and cost effective manner 14.351 667 .000 .73653 .6358 .8373 Read More
Cite this document
  • APA
  • MLA
  • CHICAGO
(“Research Findings, Statistical Analysis and interpretation for Essay - 2”, n.d.)
Research Findings, Statistical Analysis and interpretation for Essay - 2. Retrieved from https://studentshare.org/marketing/1621813-research-findings-statistical-analysis-and-interpretation-for-etisalat-telecom-corporation
(Research Findings, Statistical Analysis and Interpretation for Essay - 2)
Research Findings, Statistical Analysis and Interpretation for Essay - 2. https://studentshare.org/marketing/1621813-research-findings-statistical-analysis-and-interpretation-for-etisalat-telecom-corporation.
“Research Findings, Statistical Analysis and Interpretation for Essay - 2”, n.d. https://studentshare.org/marketing/1621813-research-findings-statistical-analysis-and-interpretation-for-etisalat-telecom-corporation.
  • Cited: 0 times

CHECK THESE SAMPLES OF Statistical Analysis and Interpretation for Etisalat Telecom Corporation

Non-Oil Sector Stocks in Saudi Arabia

Correlation: A statistical measure that describes how two variables move together with each other.... Granger-Causality test: A statistical test used to measure whether the change in one variable causes a change in another variable.... The report 'Non-Oil Sector Stocks in Saudi Arabia' will look at the major driver of economic activity in Saudi Arabia....
22 Pages (5500 words) Research Paper

Statistical Analysis and Interpretation for Etisalat Telecom Corporation

The splits allow for the analysis and developed information regarding the position of youth market and the overwhelming occurrence of the grey market across the globe.... Demographic splits and financial statements take an important position in developing world due to important information that business people acquire from the analysis of demographic splits.... It is only from the analysis of the demographic splits that information concerning the youth market and details from the grey markets, added to make a genuine report regarding companies' financial status....
9 Pages (2250 words) Essay

A Strategic Marketing Assignment on Etisalat

The company was incorporated in 1976 and has become a part of the Financial Times Top 500 corporation.... It has also been awarded for being a socially responsible corporation.... The telecom industry of the Middle Eastern countries has seen a continuous growth.... The telecom industry of the Middle Eastern countries has seen a continuous growth.... Company Information:The Company:Etisalat is one of the oldest telecom providers in UAE....
18 Pages (4500 words) Essay

The Current and Futuristic Position of Etisalat

mirates Telecommunications corporation, which operates under the brand name Etisalat is a service provider in the telecommunication sector.... The company is a joint-stock corporation held by local affiliates and internationally reputed companies such as International Aeradio Limited and another company based in Britain.... This paper 'The Current and Futuristic Position of etisalat' offers a critical examination and assessment of both the current and futuristic position of etisalat....
18 Pages (4500 words) Assignment

Difficulties and challenges for Etisalat ( Operation class)

tisalat allocate low budgets for the security team hence they end up employing few security personnel to deal with the Difficulties and Challenges for etisalat of 23RD MARCH Difficulties and challenges for etisalat Lack of man power Etisalat is a one of the biggest telecommunication Corporations in the world with its operations spread in many other countries and one of the difficulties they have is lack of man power to ensure that their operations run smoothly without interuptions....
2 Pages (500 words) Essay

A Multi-Task Workforce to Satisfy Customer Demands at Etisalat

The paper "A Multi-Task Workforce to Satisfy Customer Demands at etisalat" states that advantages to etisalat include selecting what novel skills its workforce will obtain, targeting proficiencies to meet the requirements of etisalat operation at the present and within the future.... etisalat needs to change the way it carries its operations through its workforce so that the customer can have the capacity to get all the help needed and services required from the staff without bothering himself to get up from his seat....
30 Pages (7500 words) Essay

Emirates Telecommunication Corporation (Etisalat)

The main goal of the following assignment is to examine the topic of operational management of the Emirates Telecommunication corporation (Etisalat).... Emirates Telecommunication corporation (Etisalat) is telecommunication provider established as a joint-stock company in 1976 by a British Company, Aerado Limited and local partners to offer telecommunication services (Etisalat, 2015).... Finally, the corporation focuses on creating new opportunities and enabling people to attain their goals....
5 Pages (1250 words) Assignment

Etisalat IT Infrastructure

Several complaints with reference to unauthorized upgrades and one Etisalat client said he later got a call from a corporation representative who proffered him an Al Shamil World Wide Web connection to the upgrade of the e-life package.... These suggestions are supposed to help Etisalat to deal with the speed of development seen within the ICT divisions and face economic challenges, which telecom providers all over the globe, counting Etisalat are facing.... This is because of the rising expenses of new-fangled technology essential for companies to augment their competitive edge within local and global marketplaces, escorted by drop within revenues of the international telecom business....
6 Pages (1500 words) Case Study
sponsored ads
We use cookies to create the best experience for you. Keep on browsing if you are OK with that, or find out how to manage cookies.
Contact Us