StudentShare
Contact Us
Sign In / Sign Up for FREE
Search
Go to advanced search...
Free

Statistics Problems-Week 5 - Speech or Presentation Example

Cite this document
Summary
Assume that the population of heights of female college students is approximately normally distributed with mean m of 64.37 inches and standard deviation s of 6.26 inches. A random sample of 74 heights is obtained.  Show all work. 
6. A researcher is interested in…
Download full paper File format: .doc, available for editing
GRAB THE BEST PAPER97% of users find it useful
Statistics Problems-Week 5
Read Text Preview

Extract of sample "Statistics Problems-Week 5"

1. Consider a population with  and . (A) Calculate the z-score for  from a sample of size 40. Z = (x- mu sigma = (40-67 5.76 = -4.70 (B) Couldthis z-score be used in calculating probabilities using Table 3 in Appendix B of the text?  Why or why not?No, because the maximum z-score that is reported on the table is -3.4, 3.4.(Points : 4)  2. Given a level of confidence of 95% and a population standard deviation of 9, answer the following:(A) What other information is necessary to find the sample size (n)?

Confidence interval or the margin of error(B) Find the Maximum Error of Estimate (E) if n = 72.  Show all work.ME = 1.96(SD/ sqroot(N)) = 1.96(9/sqroot(72)) = 2.08(Points : 4) 3. A sample of 134 golfers showed that their average score on a particular golf course was 87.43 with a standard deviation of 4.53.  Answer each of the following (show all workand state the final answer to at least two decimal places.:(A) Find the 99% confidence interval of the mean score for all 134 golfers.CI of 99% = +1.01 and -1.01 , 86.

42< X < 88.44(B) Find the 99% confidence interval of the mean score for all golfers if this is a sample of 105 golfers instead of a sample of 134.CI of 99% = +1.14 and -1.14 , 86.29< X < 88.57(C) Which confidence interval is smaller and why? The first sample size has a smaller confidence interval because the sample size is bigger. Because the sample size is bigger, the confidence of less error goes down.(Points : 6)      4. Assume that the population of heights of female college students is approximately normally distributed with mean m of 64.

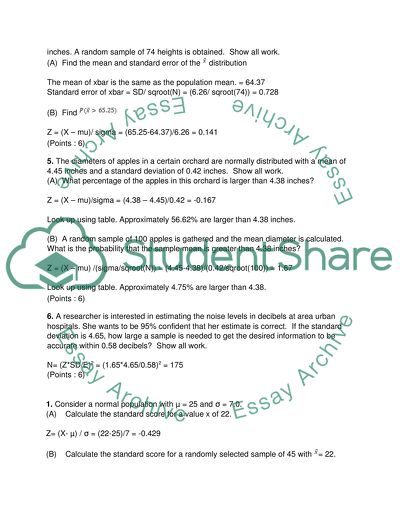
37 inches and standard deviation s of 6.26 inches. A random sample of 74 heights is obtained.  Show all work.  (A)  Find the mean and standard error of the  distribution The mean of xbar is the same as the population mean. = 64.37Standard error of xbar = SD/ sqroot(N) = (6.26/ sqroot(74)) = 0.728(B)  Find  Z = (X – mu)/ sigma = (65.25-64.37)/6.26 = 0.141(Points : 6) 5. The diameters of apples in a certain orchard are normally distributed with a mean of 4.45 inches and a standard deviation of 0.42 inches.  Show all work. (A)  What percentage of the apples in this orchard is larger than 4.38 inches? Z = (X – mu)/sigma = (4.38 – 4.45)/0.42 = -0.167Look up using table.

Approximately 56.62% are larger than 4.38 inches.(B)  A random sample of 100 apples is gathered and the mean diameter is calculated. What is the probability that the sample mean is greater than 4.38 inches? Z = (X – mu) /(sigma/sqroot(N)) = (4.45-4.38)/(0.42/sqroot(100)) = 1.67Look up using table. Approximately 4.75% are larger than 4.38.(Points : 6)6. A researcher is interested in estimating the noise levels in decibels at area urban hospitals. She wants to be 95% confident that her estimate is correct.

  If the standard deviation is 4.65, how large a sample is needed to get the desired information to be accurate within 0.58 decibels?  Show all work.  N= (Z*SD/E)2 = (1.65*4.65/0.58)2 = 175(Points : 6) 1. Consider a normal population with µ = 25 and σ = 7.0.(A)    Calculate the standard score for a value x of 22.Z= (X- µ) / σ = (22-25)/7 = -0.429(B)    Calculate the standard score for a randomly selected sample of 45 with = 22.Z = (22-25)/(7/sqroot(45)) = -2.87(C)    Explain why the standard scores of 22 are different between A and B above.

One is taking into account the normal population while the other is looking at a random selection.(Points : 6)      2. Assume that the mean SAT score in Mathematics for 11th graders across the nation is 500, and that the standard deviation is 100 points.  Find the probability that the mean SAT score for a randomly selected group of 150 11th graders is between 480 and 520. Z = (480-500)/(100/sqroot(480) = -4.38Z = (520-500)/(100/sqroot(480) = 4.38P = .9987(Points : 3)     3. Assume that a sample is drawn and z(α/2) = 1.

65 and σ = 15.  Answer the following questions: (A)If the Maximum Error of Estimate is 0.04 for this sample, what would be the sample size?N= (Z*SD/E)2 = ((1.65*15)/.04)2 = 382851.6 (B)Given that the sample Size is 400 with this same z(α/2) and σ, what would be the Maximum Error of Estimate? E= Z*SD/ sqroot(N) = (1.65*15) / sqroot(400) = 1.24(C)What happens to the Maximum Error of Estimate as the sample size gets larger?As the sample gets larger, the error gets smaller. (D)What effect does the answer to C above have to the size of the confidence interval?

As the sample gets larger, the error gets smaller. This means the confidence error shrinks.(Points : 8)       4. By measuring the amount of time it takes a component of a product to move from one workstation to the next, an engineer has estimated that the standard deviation is 3.22 seconds. Answer each of the following (show all work):(A) How many measurements should be made in order to be 98% certain that the maximum error of estimation will not exceed 0.5 seconds? N=(Z*SD/E)2= (2.05*3.22/.5)2 = 174.3 (B) What sample size is required for a maximum error of 1.5 seconds?  N=(Z*SD/E)2= (2.05*3.22/1.5)2 = 19.4 (Points : 6)       5.

A 95% confidence interval estimate for a population mean was computed to be (28.7, 40.9). Determine the mean of the sample, which was used to determine the interval estimate (show all work). Xbar – ME = 28.7Xbar + ME = 40.92Xbar = 69.6Xbar = 34.8(Points : 4)    6. A study was conducted to estimate the mean amount spent on birthday gifts for a typical family having two children. A sample of 155 was taken, and the mean amount spent was $209.67. Assuming a standard deviation equal to $48.79, find the 99% confidence interval for m, the mean for all such families (show all work).

  E = Z*SD/ sqroot(N) = 2.33*48.79/sqroot(155) = 9.13209.67 – 9.13 < X < 209.67 + 9.13200.54 < X < 218.80(Points : 4)  7. A confidence interval estimate for the population mean is given to be (35.71, 44.14).  If the standard deviation is 13.045 and the sample size is 52, answer each of the following (show all work):  (A) Determine the maximum error of the estimate, E. E = Z*SD/ sqroot(N) = 2.33*13.045/sqroot(52) = 4.22 (B) Determine the confidence level used for the given confidence interval.  35.71-4.

22 < X < 35.71+4.2231.49 < X < 39.93(Points : 4)       

Read More
Cite this document
  • APA
  • MLA
  • CHICAGO
(“Statistics Problems-Week 5 Speech or Presentation”, n.d.)
Statistics Problems-Week 5 Speech or Presentation. Retrieved from https://studentshare.org/miscellaneous/1575444-statistics-problems-week-5
(Statistics Problems-Week 5 Speech or Presentation)
Statistics Problems-Week 5 Speech or Presentation. https://studentshare.org/miscellaneous/1575444-statistics-problems-week-5.
“Statistics Problems-Week 5 Speech or Presentation”, n.d. https://studentshare.org/miscellaneous/1575444-statistics-problems-week-5.
  • Cited: 0 times

CHECK THESE SAMPLES OF Statistics Problems-Week 5

Applied statistics for economics

Applied statistics For Economics ... Stock market prediction has been of major interest to the statisticians and econometricians for quite some time.... Having an accurate idea and knowledge relating the future performance helps traders and farmers to invest in the most viable business opportunities thus maximizing the profits....
10 Pages (2500 words) Essay

Process Improvement Plan

Excel sheet in the appendix contains steps of calculation reflecting control limit, descriptive statistics, confidence interval, and graphs to analyze laundry process for implementing process improvement plan (PIP).... Descriptive statistics of the Laundry Plotting of days on x-axis and sorting time in seconds on the vertical axis is the basis of control charts....
4 Pages (1000 words) Essay

Discussion Questions Week 5

Having a position in a meat processing plant where quality is always a consideration to satisfy the company's clients, I think the most important concept that I have learned from this Business statistics class for the past five weeks is the examination of small population… In our day to day operation, quality is often checked by looking at a sample of meat processed which ranges from 100-300 observations.... Having a position in a meat processing plant where quality is always a consideration to satisfy the company's clients, I think the most important concept that I have learned from this Business statistics class for the past five weeks is the examination of small population which have non-standard distribution....
2 Pages (500 words) Essay

Cholesterol and Cardiovascular Disease in the Elderly

A study is conducted to determine if adults over 50 years old with higher total cholesterol levels are more hostile than those with lower cholesterol levels.... ? A group of 100 adults is randomly selected and their level of hostility as well as their cholesterol levels is… Answer: for the above table the regression line between x and y is y = -2-4x when x is independent and y is dependent....
4 Pages (1000 words) Speech or Presentation

A Comparison between Non-smokers and Smokers

The paper "A Comparison between Non-smokers and Smokers" discusses that the session will offer tips on how to avoid secondary effects of smoking in society, especially to non-smokers.... I addition, it will seek to promote withdrawal tips for pervasive smokers and healthy diet regimens.... hellip; Sessions 1 and 2 for week one will focus on the introduction of smoking as a social and health problem through statistical facts and indicators of the problem....
9 Pages (2250 words) Assignment

Week 5 practice problems

ere, I have two groups and therefore, I will use their means to calculate the t statistics.... I use the t statistics since one group has a size less than 30.... I will use the F statistics in the analysis.... Therefore, I am 95% confident that the average sleeping and waking cycle length does not vary significantly from 24hrs even if one is not exposed to the usual pattern of sunlight....
2 Pages (500 words) Assignment

Quantitative Analysis of Healthy Ageing in England

In UK as today we have over 15,000 population of senior citizen aged 100 years and above (Crown copyright, 2014).... The retirement age has… World Health Organization has been promoting a healthy ageing as people's ability regardless of age to have a healthy living, socially inclusive lifestyle and safe living....
16 Pages (4000 words) Assignment

Statistical Assessment of Traditional and Nontraditional Students

The paper "Statistical Assessment of Traditional and Nontraditional Students" aims at finding out whether traditional and nontraditional students differ in their statistics anxiety and attitude to statistics.... hellip; The study will also establish whether there is a relationship between anxiety and attitude towards statistics and the performance of students in statistics.... The report will give recommendations that can be used to improve or reduce anxiety levels and create a positive attitude towards statistics among the students....
12 Pages (3000 words) Essay
sponsored ads
We use cookies to create the best experience for you. Keep on browsing if you are OK with that, or find out how to manage cookies.
Contact Us