StudentShare
Contact Us
Sign In / Sign Up for FREE
Search
Go to advanced search...
Free

A Questionnaire as the Mostly Used Data Collection Tool - Research Paper Example

Cite this document
Summary
The paper "A Questionnaire as the Mostly Used Data Collection Tool" states that in the last 5 years, 29.3% of the participants had participated in 1 conference, 29% had participated in 2 conferences, 30% had not participated in any while 11.7% had participated in 3 or more conferences. …
Download full paper File format: .doc, available for editing
GRAB THE BEST PAPER92.8% of users find it useful
A Questionnaire as the Mostly Used Data Collection Tool
Read Text Preview

Extract of sample "A Questionnaire as the Mostly Used Data Collection Tool"

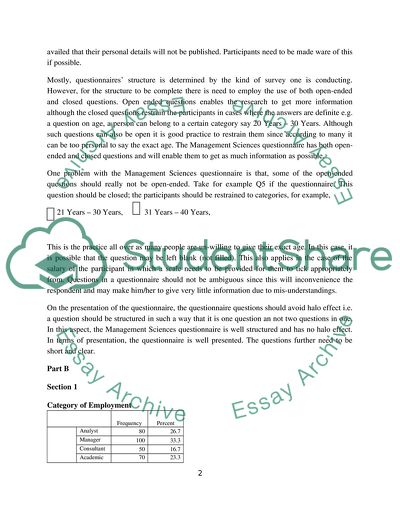
Part A Questionnaire Evaluation A questionnaire is the mostly used data collection tool. This is so because they can either be mailed to the respondents, administered face to face or they can be used as interview guides. The decision to use a questionnaire to collect data by the Management Sciences is a positive thing in the delivery of services to its members. Questionnaires are used mostly since the researcher has control of how to treat most of the responses while analysing the data. On the part of the participant, a questionnaire is better sine he/she can respond at his/her own pace and also the fact that they can be administered to so many people at the same time (like in conferences and other gatherings). The only problem with mailed questionnaires is that they may fail to reach their destination thus affecting the final return rate. While evaluating questionnaires as a method for collecting data, some aspects are put into perspective. Mainly these aspects are guided by ethical practices which guide the research study in order to attain the required rigor. Research ethics demands that a respondent is informed of any financial benefits for taking part in any survey. According to researchers this is a morale booster and often makes the respondent to give as much information as possible. The Management Sciences questionnaire is positive in that the respondents are informed if a possible financial benefit; they will be entered for a competition draw with a possible price of 200 pounds worth of gift vouchers. Further, it is important to always inform your respondents the importance of the survey; is it to benefit them or why do they count in your survey. This is an aspect which is clearly put across in the opening statement of the Management Sciences questionnaire. Security of participant data/information is very important in any survey and should always be guaranteed. Participants in any research study are always informed of the security of the information they give in the introduction part of the questionnaire. This is not the case with the Management if Sciences questionnaire. Participants are not made aware of the security of the data/information they are about to give. According to Kimote (2008), research participant’s data security is an important ingredient for the research study to achieve the required scientific rigor. According to him, this is so because, the data may be used both internally (by the researcher or the organization carrying out the research in this case Management Sciences) and externally maliciously. Thus, the Management Sciences questionnaire should have a statement assuring the participants that the information they are about to give will be confidential and will be used for the sole purpose of the proposed research study. Under the institute member part, the first question of the wants the participant to enter his/her name while the last statement of the introduction talks of publishing the same findings on the Institutes Website. These will in-fridge the rights of the participants unless confirmation is availed that their personal details will not be published. Participants need to be made ware of this if possible. Mostly, questionnaires’ structure is determined by the kind of survey one is conducting. However, for the structure to be complete there is need to employ the use of both open-ended and closed questions. Open ended questions enables the research to get more information although the closed questions restrain the participants in cases where the answers are definite e.g. a question on age, a person can belong to a certain category say 20 Years – 30 Years. Although such questions can also be open it is good practice to restrain them since according to many it can be too personal to say the exact age. The Management Sciences questionnaire has both open-ended and closed questions and will enable them to get as much information as possible. One problem with the Management Sciences questionnaire is that, some of the open-ended questions should really not be open-ended. Take for example Q5 if the questionnaire. This question should be closed; the participants should be restrained to categories, for example, 21 Years – 30 Years, 31 Years – 40 Years, This is the practice all over as many people are un-willing to give their exact age. In this case, it is possible that the question may be left blank (not filled). This also applies in the case of the salary of the participant in which a scale needs to be provided for them to tick appropriately from. Questions in a questionnaire should not be ambiguous since this will inconvenience the respondent and may make him/her to give very little information due to mis-understandings. On the presentation of the questionnaire, the questionnaire questions should avoid halo effect i.e. a question should be structured in such a way that it is one question an not two questions in one. In this aspect, the Management Sciences questionnaire is well structured and has no halo effect. In terms of presentation, the questionnaire is well presented. The questions further need to be short and clear. Part B Section 1 Category of Employment Frequency Percent Analyst 80 26.7 Manager 100 33.3 Consultant 50 16.7 Academic 70 23.3 Total 300 100.0 Of the 300 participants, 33% (100) were managers, 26.7% (80) were Analysts, 23.2% (70) were academics while the remaining 16.7% (50) were consultants. Level of Membership Frequency Percent Graduate 65 21.7 Member 127 42.3 Fellow 108 36.0 Total 300 100.0 The majority were members with 42.3% representation. Fellows formed 36% of the population while graduates were 21.7%. Location Frequency Percent Scotland 19 6.3 North England 17 5.7 Midlands/Wales 46 15.3 South West London 53 17.7 South East London 165 55.0 Total 300 100.0 55% of the participants came from South East London. South West London had 17.7% representation while Midlands had 15.3% representation. North England had the lowest representation with 5.7% of the population. Gender Frequency Percent Female 73 24.3 Male 227 75.7 Total 300 100.0 Of the total 300 participants, 227 representing 75.7% were females while the remaining 24.3% (73) were male. Age Frequency Percent 21-30 Yrs 52 17.3 31-40 Yrs 111 37.0 41Yrs and Above 137 45.7 Total 300 100.0 Those between 41 years and above formed the majority of the participants with 45.7% representation. 21-30 years had 17.3 representation while 31-40 had a representation of 37%. Salary scale Frequency Percent 10-20.9 (£k) 12 4.0 21-29.9 (£k) 106 35.3 30-39.9 (£k) 153 51.0 40 (£k) + 29 9.7 Total 300 100.0 The majority earned a salary of 30-39.9 (£k). of the 300 participants, 69.7% had not made any job move in the last five years. 24.3% had made one move, 5.7% had made 2 moves while 0.3% had made 3 moves. Further, 21% had taken their current jobs in response to advertisement in the magazine with 79% taking jobs not in response to the advertisements. In the last 5 years, 29.3% of the participants had participated in 1 conference, 29% had participated in 2 conferences, 30% had not participated in any while 11.7% had participated in 3 or more conferences. On the greatest barriers to conference attendance, 68.7% felt that the discussion topics were a great barrier. 67.7 said location of the event was an inconvenience, 43.3% said the timing of the event was barrier, 18% gave domestic reasons as an inconvenience while 59.7% said workload. On attendance, 53.4% said they had attended the conferences in the last 5 years due to interest in the discussion subjects, 73.7% said they attended due to networking opportunities, 25% said attendance was meant for personal development while 63.7% said they had attended for professional development. How useful are conferences Frequency Percent Very useful 97 32.3 Quite useful 114 38.0 Not very useful 45 15.0 Not at all useful 44 14.7 Total 300 100.0 Of those who attended, 38% agreed that conferences were quite useful while 32.3% felt that they were very useful. 15% said they were not very useful while 14.7% said they were not useful at all. In general, conferences are useful. What is your opinion on conferences Frequency Percent Too formal 25 8.3 About right 239 79.7 Too informal 36 12.0 Total 300 100.0 79.7% of the participants felt that conferences are right although 12% said they are too informal in addition to 8.3% saying they are too formal. Very interested (%) Quite interested (%) Not interested (%) Financial modeling 58.7 29.7 11.7 Forecasting 49.3 29.7 21 Health 14.3 16.3 69.3 Information systems 16.7 29.3 54 Processes in OR 56.3 29 14.7 Project management 55.3 35.3 9.3 Simulation 51 32 17 Soft systems 29.7 31.3 39 Strategy in OR 54.3 26.7 19 Systems dynamics 17.7 29.3 53 Most of the participants were interested in financial modeling followed by Processes in OR then by project management and then by strategy in OR. Many of the participants have very little interest in health and system dynamics. What is your view on frequency of the Institute Magazine Frequency Percent Too few 27 9.0 About right 243 81.0 Too many 30 10.0 Total 300 100.0 81% of the respondents agree that the frequency of the institute magazine is about ok. The majority also say that they are satisfied with the content of the magazine. Happy with the Content Frequency Percent Very satisfied 107 35.7 quite satisfied 119 39.7 quite satisfied 44 14.7 Very dissatisfied 30 10.0 Total 300 100.0 Information most useful in the Magazine Information on: Very interested (%) Quite interested (%) Not interested (%) Information on conference 30.3 39.3 30.3 Information on local events 23.3 40.3 36.3 Institute developments 30.3 37 32.7 Recruitment vacancies 51.3 28 20.7 Literature on training courses 30.7 56 13.3 literature on academics sources 31.7 39.7 28.7 The most useful information the magazine is on recruitment vacancies followed by literature on training courses. Information on local events is least important. What is your view on frequency of the Institute Journal Frequency Percent Too few 13 4.3 About right 266 88.7 Too many 21 7.0 Total 300 100.0 On the frequency of the journal, 88.7% agree that it is ok and are satisfied with the information it contains. What information is useful in the journal? Very interested (%) Quite interested (%) Not interested (%) Academic papers 32.7 28.7 38.7 Practitioner papers 50.3 29.7 20 Book reviews 31.7 29.3 39 In the journal, the most useful information is that on practitioner papers, followed by academic papers and then by book reviews. 94% of the participants have access to the internet and access the institute website on weekly basis in addition to agreeing that the site looks good and is user friendly. 38.7% agree that the site is easy to get in the net, 38.3% agree that it is easy to navigate, 41% agree that the site is easy to download from while 17.7% agree that the site is eye catching. 78% know the UK committee members while 72% know how to contact them. 12.3% agree to being contacted and involved in the committees in the regional level. Section 2 To come up with the results of this part, mean salary tables were produced by gender, category of employment, level of membership, location, age and by job moves. This was done in order to indicate the difference in salary. Salary by gender Gender Mean N Std. Deviation Female 31.221 73 5.5612 Male 32.121 227 6.1445 Total 31.902 300 6.0112 Males earn better than their female counter parts. Males earn salary of 32,121 pounds while females earn a mean salary 31,221 pound. However, male salary is more varying than that of females. This in-equality needs to be harmonized in order to create a better working relationship among the staff. Salary by category of employment Category of Employment Mean N Std. Deviation Analyst 27.004 80 4.7168 Manager 33.736 100 5.5928 Consultant 35.892 50 4.3864 Academic 32.029 70 5.3219 Total 31.902 300 6.0112 Consultants are the best paid with a mean salary of 35,892 pound followed by managers with a mean salary of 33,726 pounds. Analysts are the lowest paid with a mean salary of 27,004 pound. The variability in salary is not significant at 95% level of significance. Salary by level of membership Level of Membership Mean N Std. Deviation Graduate 28.260 65 6.6780 Member 32.367 127 5.1955 Fellow 33.546 108 5.6098 Total 31.902 300 6.0112 Fellows are the highly paid with a mean salary of 33,546 pounds. Graduates are the lowest paid with a salary of 28,260 pounds. The salary difference is an encouragement for individuals to join the Management Sciences. Salary by location Location Mean N Std. Deviation Scotland 24.274 19 5.5957 North England 28.282 17 4.4558 Midlands/Wales 28.089 46 5.4541 South West London 31.940 53 4.7744 South East London 34.204 165 5.2543 Total 31.902 300 6.0112 Those located in South East London are the best paid with a mean salary of 34,204 pound while those in Scotland are the lowest paid having a mean salary of 24,274 pound. South West London people earn a mean salary of 31,940 pounds. In North England, the mean salary is 28,282 pounds while the mean salary for those in Midlands/Wales is 28,089 pound. Salary by Age Age Mean N Std. Deviation 21-30 Yrs 24.798 52 4.0172 31-40 Yrs 29.550 111 3.2858 41Yrs and Above 36.503 137 4.4188 Total 31.902 300 6.0112 Age determines one’s salary; the more the years the more the salary. Many years means one is experienced. Those whose age is 41 years and above earn better than the rest of the group with a mean salary of 36,503 pounds. The middle aged i.e. 31-40 years earns 29,550 pounds on average while the young i.e. earn an average of 24,798 pounds. Salary by Job Moves Jobs left Mean N Std. Deviation 0 31.358 209 5.5483 1 31.547 73 6.3532 2 39.365 17 4.4619 3 44.500 1 . Total 31.902 300 6.0112 From the analysis, the more the job moves the more the salary. People leave one job for another because of the monies involved. Those who have 3 job moves earn 44,500 pounds on average while those who have not made any move earn 31,358 pounds. If one has made a single move, he/she earns 31,547 while those who have moved twice earn 39,365 on average. In conclusion, salary significantly depends on ones gender, age, level of membership, job category, number of job moves and location. Section 3 Salary prediction is done using ANOVA test. This is done using linear regressions analysis where salary is considered as the dependent variable; depending entirely on age, job moves, employment category, membership level and location, which are the independent variables in this research study. Below are the results of the regression analysis. ANOVA Model Sum of Squares df Mean Square F Sig. 1 Regression 10109.187 6 1684.864 710.267 .000 Residual 695.042 293 2.372 Total 10804.229 299 Predictors: (Constant), Jobs left, Gender, Level of Membership, Location, Age, Category of Employment Dependent Variable: Salary scale From the ANOVA table above, it is evident that salary amounts are contributed to significantly by Jobs left, Gender, Level of Membership, Location, Age and Category of Employment at 95% level of significance. A significance level of .000 (.000 Read More
Cite this document
  • APA
  • MLA
  • CHICAGO
(A Questionnaire as the Mostly Used Data Collection Tool Research Paper, n.d.)
A Questionnaire as the Mostly Used Data Collection Tool Research Paper. Retrieved from https://studentshare.org/professional/1726819-business-research-analysis
(A Questionnaire As the Mostly Used Data Collection Tool Research Paper)
A Questionnaire As the Mostly Used Data Collection Tool Research Paper. https://studentshare.org/professional/1726819-business-research-analysis.
“A Questionnaire As the Mostly Used Data Collection Tool Research Paper”, n.d. https://studentshare.org/professional/1726819-business-research-analysis.
  • Cited: 0 times

CHECK THESE SAMPLES OF A Questionnaire as the Mostly Used Data Collection Tool

Protected populations of people

In data collection, several ways exist.... Questionnaires are the most used in data collection due to the fact that; the participant gives more information than he/she would have given in any other method.... a questionnaire is one the ways of collecting data.... Also, the designer will have the freedom to control some responses making it easy to analyze the data....
7 Pages (1750 words) Essay

Business descision making

The primary data collection was done by gathering data from a random sample of 150 people from UK by way of a set of questionnaires that primarily asked the factors that most clients would consider when looking for a car.... Secondary data collection was done by analyzing the accounting record and customer records of RH cars and other car companies' websites and these form part of the literature review of this research.... To get these results, data was collected To begin with, the report will look at the background to the study and the hypotheses which will discus the project plan and implementation strategies....
12 Pages (3000 words) Essay

Questionnaires as the Method of Data Collection

The paper "Questionnaires as the Method of data collection" describes that the introductory period is the most important as this is the key period for the student.... The nature of the data also raised a few issues.... he sampling method used in this research is a non-probability convenient sampling.... The questionnaire contained 14 sections each with one question apart from section 14.... The questionnaire can be found in Appendix 1....
10 Pages (2500 words) Essay

What Customers Needs to Be Improved so as to Attract Travelers while Searching for Accommodation

She supports her assertions by arguing that, this is the same reason as to why in any hotel one visits, there is always a questionnaire dealing with the most touching aspects of the hotel and further requesting whether the respective customers would like an improvement on any of the services being offered by its staff; things ranging from foods, drinks, staff conduct as well as the beddings.... nbsp;… Nowadays, the use of data to explain a point, justify a claim and to influence a decision has become the order of the day....
8 Pages (2000 words) Research Paper

Method of Data Collection in Conducting Business Research

The author gives a detailed information about  the types of errors that can take place while conducting a survey, illustrates how attitude measurement can help management of employees and discusses the reasons the possible drawbacks of the method of personal interview… The author focuses on qualitative survey methods which are the methods that allow better impulsiveness and adaptation in the dealings between the participant and the researcher....
6 Pages (1500 words) Term Paper

Statistical Method of Analysis of the Transport in London

Surveying is a statistical method that is used in data collection as well as measuring data.... Surveying is a primary method of data collection and it encompasses sampling, questionnaires and interviews.... In the research, therefore, questionnaires were the major method that was applied to the collection of data.... This paper "Statistical Method of Analysis of the Transport in London" focuses on the analysis of the data that was collected using questionnaire....
8 Pages (2000 words) Assignment

Questionnaire-Research Method in Business

For example, close-ended questions are mostly used in the quantitative research method.... hellip; The author states that the questionnaire remains an important research tool for collecting data.... Additionally, both types of questions (close-ended and open-ended questions) are used to collect first-hand information from the potential respondents.... The questionnaire mostly consists of a number of questions that are asked by respondents....
10 Pages (2500 words) Dissertation

Research Role in All Fields of Studies

a questionnaire was administered to a sample where the respondents were asked a number of questions about current global events such as the resurgence of the Islamic State and the Russian-Ukrainian Conflict.... Usually, data is collected from a sample or population then analyzed.... Additionally, data is collected within a stipulated timeframe.... he cross-sectional design was used to investigate the validity of the hypothesis....
6 Pages (1500 words) Essay
sponsored ads
We use cookies to create the best experience for you. Keep on browsing if you are OK with that, or find out how to manage cookies.
Contact Us