StudentShare
Contact Us
Sign In / Sign Up for FREE
Search
Go to advanced search...
Free

Fundamental Statistics for the Behavior Sciences - Assignment Example

Cite this document
Summary
This assignment "Fundamental Statistics for the Behavior Sciences" discusses a considerable variation amongst the salaries on the basis of gender and the concept of equal pay for equal work does not seem to have been implemented in its true sense…
Download full paper File format: .doc, available for editing
GRAB THE BEST PAPER96.1% of users find it useful
Fundamental Statistics for the Behavior Sciences
Read Text Preview

Extract of sample "Fundamental Statistics for the Behavior Sciences"

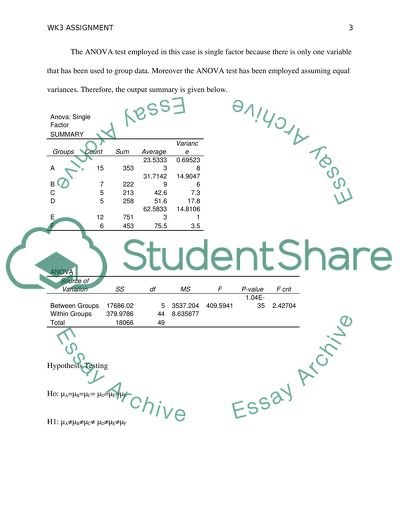
Wk3 Assignment Wk3 Assignment Question The following table was generated in order to perform Analysis of Variance using Analysis Tool Pack of MS Excel 2007. A B C D E F 23 27 41 47 58 76 22 34 42 57 66 77 23 36 47 50 60 76 24 34 40 49 69 75 24 28 43 55 64 72 24 28     56 77 23 35     60   24       65   24       62   24       65   24       60   23       66   22           25           24           The ANOVA test employed in this case is single factor because there is only one variable that has been used to group data. Moreover the ANOVA test has been employed assuming equal variances. Therefore, the output summary is given below. Anova: Single Factor SUMMARY Groups Count Sum Average Variance A 15 353 23.53333 0.695238 B 7 222 31.71429 14.90476 C 5 213 42.6 7.3 D 5 258 51.6 17.8 E 12 751 62.58333 14.81061 F 6 453 75.5 3.5 ANOVA Source of Variation SS df MS F P-value F crit Between Groups 17686.02 5 3537.204 409.5941 1.04E-35 2.42704 Within Groups 379.9786 44 8.635877 Total 18066 49         Hypothesis Testing Ho: µA=µB=µC= µD=µE=µF H1: µA≠µB≠µC≠ µD≠µE≠µF Where µA shows the average salaries for Grade A, µB shows the average salaries for Grade B, µC shows the average salaries for Grade C, µD shows the average salaries for Grade D, µE shows the average salaries for Grade E and µF shows the average salaries of Grade F employees. Level of significance The level of significance chosen for hypothesis testing is 0.05. Decision Rule We reject Ho, if the P-value is found to be less than 0.05 significance level. Test Statistics The test statistics employed to test the sample means is F statistics while the decision making criteria involves the use of P-value. Decision Since the P-value, as mentioned in the table, is found to be less than 0.05, therefore, we cannot accept null hypothesis which states that the average salaries of employees of each grade is equal. It can thus be concluded that significant difference exists in the average salaries of employees at different grades. Question #02 Anova: Two-Factor With Replication SUMMARY A B C D E F Total M               Count 2 2 2 2 2 2 12 Sum 49 55 87 96 122 153 562 Average 24.5 27.5 43.5 48 61 76.5 46.8333 Variance 0.5 0.5 24.5 2 50 0.5 364.515 F               Count 2 2 2 2 2 2 12 Sum 46 70 83 107 134 152 592 Average 23 35 41.5 53.5 67 76 49.3333 Variance 2 2 0.5 24.5 8 2 367.333 Total             Count 4 4 4 4 4 4 Sum 95 125 170 203 256 305 Average 23.75 31.25 42.5 50.75 64 76.25 Variance 1.58333 19.5833 9.66667 18.9167 31.3333 0.91667 ANOVA Source of Variation SS df MS F P-value F crit Sample 37.5 1 37.5 3.84615 0.07348 4.74723 Columns 7841.83 5 1568.37 160.858 1.5E-10 3.10588 Interaction 91.5 5 18.3 1.87692 0.17231 3.10588 Within 117 12 9.75 Total 8087.83 23         Interpretation of output The first null hypothesis that states that average salaries for all grades are equal is accepted as the associated P value is found to be equal to 0.07 which is greater than 0.05. The second null hypothesis that states that average salaries for both male and female employees are equal is, however, rejected as the associated P value is found to be equal to 1.5 x 10⁻¹⁰ which is quite less than the significance level 0.05. The third null hypothesis that tests whether the interaction is statistically significant is found to be statistically significant as the associated P value is found to be 0.17 which is significantly greater than the significance level of 0.05. It means that the grades and gender do have an interaction that impacts the equality of pays amongst employees on average. Moreover it shows that the mean salaries are equal amongst different grades while they are found to be unequal amongst male and female employees without considering their grades. Moreover in order to avoid biasness in the results the observations have been chosen at random so that the sample results can be employed for the interpretation of population parameters. Therefore mean value in this case can be used to interpret the results of mean values of population. Question #3 In order to test that the compa values in the population are equal by grade and/or gender, and are independent of each factor the ANOVA has been done using Data Analysis Tool pack of MS Excel 2007. The values are chosen on convenience basis for each category. The summary of outputs thus obtained is mentioned below. The two factor ANOVA has been performed with replication. Anova: Two-Factor With Replication SUMMARY A B C D E F Total Male               Count 2 2 2 2 2 2 12 Sum 2.086 1.773 2.175 1.999 2.209 2.283 12.525 Average 1.043 0.8865 1.0875 0.9995 1.1045 1.1415 1.04375 Variance 0 0.000545 0.015313 0.000841 0.005512 0.000113 0.009638 Female               Count 2 2 2 2 2 2 12 Sum 1.956 2.257 2.075 2.228 2.35 2.329 13.195 Average 0.978 1.1285 1.0375 1.114 1.175 1.1645 1.099583 Variance 0.000968 0.002112 0.000313 0.010658 0.00245 0.004141 0.007255 Total       Count 4 4 4 4 4 4 Sum 4.042 4.03 4.25 4.227 4.559 4.612 Average 1.0105 1.0075 1.0625 1.05675 1.13975 1.153 Variance 0.001731 0.020407 0.006042 0.008203 0.004311 0.001594 ANOVA Source of Variation SS df MS F P-value F crit Sample 0.018704 1 0.018704 5.224141 0.041256 4.747225 Columns 0.077663 5 0.015533 4.338302 0.01736 3.105875 Interaction 0.065194 5 0.013039 3.641802 0.030919 3.105875 Within 0.042964 12 0.00358 Total 0.204525 23         The hypotheses in this case will be Ho: Average Compaq values are equal for all grades Ha: Average Compaq values are not equal for all grades Ho: Average Compaq values by gender are equal Ha: Average Compaq values by gender are not equal Ho: Interaction is not significant Ha: Interaction is significant Interpretation of outputs All three null hypotheses are rejected as the associated P values are found to be less than the significance level of 0.05. It means that average Compaq values are not equal by gender as well as by grade. Moreover the interaction is also found to be insignificant. It can thus be concluded that on average the Compaq values are found to be significantly different amongst employees on the basis of gender as well as on the basis of grades. Question #04 Using the Pivot Table option the following table was generated that contains the average ages of employees grouped by gender and grade. The reason of choosing “Age” as variable for analysis is that, I wanted to test whether male and female employees are hired on each level at same ages or any distinction exists on the basis of gender. Average of Age Column Labels Row Labels A B C D E F Grand Total F 30 33 31 38 31 43 33 M 32 34 35 41 41 45 39 Grand Total 30 34 33 39 39 44 36 Now this data table is utilized to perform two-way ANOVA without replication using Data Analysis Tool pack of MS Excel 2007. This test requires that there is no interaction between the groups of sample and so the concerned variable is tested on the basis of each group independent of the other. The summary of output is mentioned below. Anova: Two-Factor Without Replication SUMMARY Count Sum Average Variance F 6 205.3333333 34.22222222 27.26296296 M 6 227.6333333 37.93888889 23.94685185 A 2 62.16666667 31.08333333 3.125 B 2 67.33333333 33.66666667 0.888888889 C 2 65.66666667 32.83333333 6.722222222 D 2 78.5 39.25 3.125 E 2 71.3 35.65 53.045 F 2 88 44 2 ANOVA Source of Variation SS df MS F P-value F crit Rows 41.44083333 1 41.44083333 7.544222503 0.04047 6.607891 Columns 228.5837963 5 45.71675926 8.322646439 0.018169 5.050329 Error 27.46527778 5 5.493055556 Total 297.4899074 11         Hypotheses In order to perform Analysis of Variance the following hypotheses are drawn. Ho: The mean age of employees is equal by gender Ha: The mean age of employees is not equal by gender Ho: The mean age of employees is equal for all grades Ha: The mean age of employees is not equal for all grades Interpretation The first null hypothesis is rejected at 0.05 significance level as the associated P-value is found to be less than 0.05. It shows that there is a significant difference amongst mean ages of male and female employees. The second null hypothesis is also rejected at 0.05 significance level as the associated P-value is found to be less than 0.05. Therefore, it can be said that mean age varies amongst employees at various grades. Question#05 From the analysis performed it seems that there exists a considerable variation amongst the salaries on the basis of gender and the concept of equal pay for equal work does not seem to have been implemented in its true sense. However, these conclusions are based on the statistical analysis performed which may be biased due to the selection of values for each variable or biasness may also have resulted during the collection of data (Howell, 2011). References Howell, D. C. (2011). Fundamental Statistics for the Behavior Sciences, 7th ed. Belmont, CA: Wadsworth, Cengage Learning. Read More
Cite this document
  • APA
  • MLA
  • CHICAGO
(“Wk3 Assignment Example | Topics and Well Written Essays - 1500 words”, n.d.)
Wk3 Assignment Example | Topics and Well Written Essays - 1500 words. Retrieved from https://studentshare.org/statistics/1649405-wk3-assignment
(Wk3 Assignment Example | Topics and Well Written Essays - 1500 Words)
Wk3 Assignment Example | Topics and Well Written Essays - 1500 Words. https://studentshare.org/statistics/1649405-wk3-assignment.
“Wk3 Assignment Example | Topics and Well Written Essays - 1500 Words”, n.d. https://studentshare.org/statistics/1649405-wk3-assignment.
  • Cited: 0 times

CHECK THESE SAMPLES OF Fundamental Statistics for the Behavior Sciences

Orgnizational behiviour and Human Resources

The modern workplace, in the era of globalisation, now evokes significant interest, as it comprises of numerous multinational companies with employees from all parts of the world.... ... ... ... The modern workplace, in the era of globalisation, now evokes significant interest, as it comprises of numerous multinational companies with employees from all parts of the world....
8 Pages (2000 words) Dissertation

Contribution to Cognitive Behavioral Therapy by Aaron Beck

As a result of his fundamental understanding of behavior and cognition, he was able to design a revolutionary style of therapy that incorporated the once two separate fields.... As a result, his therapeutic technique is based on correcting the abnormal thought patterns to promote a change in the client's behavior.... ymbiosis of behavior and the Cognitive RevolutionDevelopmentally in psychology, this shows a bridge of two different philosophies that have developed throughout psychology....
8 Pages (2000 words) Essay

Relationship between Dominating Interpersonal Behavior and Perceived Victimization in Groups

The paper 'Relationship between Dominating Interpersonal behavior and Perceived Victimization in Groups' finds out the difference between the author's qualitative approach to analyzing the interaction of the studied groups and the quantitative approach of authoritative researchers.... In this study evaluated, the authors used a victim precipitation model to predict that members of workgroups who were perceived by others as showing either high or low levels of dominating behavior also reported as being more frequent targets of personally injurious behaviors than those who were mild to moderately dominating....
9 Pages (2250 words) Assignment

Political Ideologies of the United States

21) Determinism – an ideal connected with the struggle for certain knowledge - upholds the propositions of the natural sciences as it more demonstrate the order of the universe better than psychology as a social science.... Ideas in the sciences (p.... 22) Here, formulae are devised that allowed behavior to be predicted, and that technology could be achieved that would enable environmental conditions to be so manipulated that behavior can be....
1 Pages (250 words) Essay

Statistics Term Paper

This paper includes the discussion of ANOVA as a significant statistical tool for business and economics especially in inferential statistics and in tests of difference for three or more independent group variables or data.... The advantage of ANOVA can be observed if one would try to compare it with Interpretation of data and results is one fundamental concern of using statistics in the fields of business and economics.... Analysis of variance is a significant component of inferential statistics and it tries to measure the difference between two or more independent groups or variables....
5 Pages (1250 words) Essay

Descriptive Statistics (SLP)

statistics for the Behavioral Sciences.... In light of this information, the writer will critically analyze and compare the testability of their hypothesis to descriptive statistics used in a published study.... Therefore, this paper Descriptive statistics due: Descriptive statistics Descriptive statistics are methods used to summarize large sets of numerical information.... In light of this information, the writer will critically analyze and compare the testability of their hypothesis to descriptive statistics used in a published study....
2 Pages (500 words) Essay

Role of Statistics in Politics

This trend is found to be on the increase with more complex quantitative research on social sciences appearing in popular journals.... The writer of the paper "Role of statistics in Politics' suggests that despite the power of statistics to make clear information is evident, the high possibility of misusing the tool is prevalent in politics.... It has been proved widely through all fields that statistics is the only tool that converts real-world information into knowledge....
11 Pages (2750 words) Research Paper

Aaron Beck and Cognitive Behavioral Therapy

As the behavioral and biological sciences were studied under greater scrutiny, the field of therapy developed.... As a result of his fundamental understanding of behavior and cognition, he was able to design a revolutionary style of therapy that incorporated the once two separate fields.... After witnessing that there was more to human behavior than genetics, psychologists began to explore the role that the external behavior played in the role of the development of a person....
8 Pages (2000 words) Coursework
sponsored ads
We use cookies to create the best experience for you. Keep on browsing if you are OK with that, or find out how to manage cookies.
Contact Us