StudentShare
Contact Us
Sign In / Sign Up for FREE
Search
Go to advanced search...

Descriptive & Inferential Statistics - Assignment Example

Cite this document
Summary
In order to observe high school dropout rates and how they correlate with “Individual Characteristics”, we examined data from various sources on national high school dropout rates of students ages 16 to 24. The data used to analyze the relationship between dropouts and…
Download full paper File format: .doc, available for editing
GRAB THE BEST PAPER94.1% of users find it useful
Descriptive & Inferential Statistics
Read Text Preview

Extract of sample "Descriptive & Inferential Statistics"

Download file to see previous pages

Before then, the data for White and Black students included students of Hispanic ethnicity, so the analysis would not have been valid. The stats used to analyze the relationship between high school dropout rates and family income was provided by . The literature we read about school characteristics lead us to focus on the impact of attendance rates and wealth expenditures per pupil on high school dropout rates in the state of Maryland. The data used to analyze the relationship between high school dropout rates and school characteristics came the Maryland State Department of Education’s “2014 Maryland Report Card.

” Since 2003, the Maryland State Department of Education has been collecting and publishing data on each of its schools, kindergarten through 12th grade, in each county in Maryland. Data for 2014 is incomplete, so the most complete statistics are available from 2003 through 2013. These data measure many important school characteristics, as well as calculating and reporting the drop-out rates for schools and counties. Among the most significant measures included in the report card are the number of students who missed 5 or fewer days of school each year, those who missed 90 or more days of school each year, the number of days of attendance each year, and wealth expenditures per pupil.

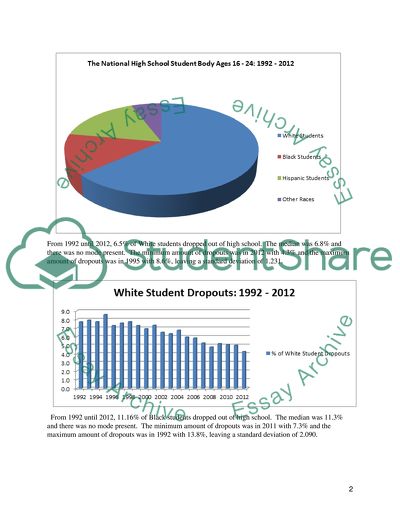
Those four characteristics, including the dropout rates, are summarized here. From 1992 til 2012, there were 738,931 high school students of all races between the ages of 16 and 24 years old. Out of the 738,931 students, 469,016 of them identified as white, 106,216 of them identified as black and 120,321 of them identified as Hispanic; which leaves 43,378 students without any racial identification. From 1992 until 2012, 6.5% of White students dropped out of high school. The median was 6.8% and there was no mode present.

The minimum amount of dropouts was in 2012 with 4.3% and the maximum

...Download file to see next pages Read More
Cite this document
  • APA
  • MLA
  • CHICAGO
(“Descriptive & Inferential Statistics Assignment”, n.d.)
Descriptive & Inferential Statistics Assignment. Retrieved from https://studentshare.org/statistics/1661549-descriptive-inferential-statistics
(Descriptive & Inferential Statistics Assignment)
Descriptive & Inferential Statistics Assignment. https://studentshare.org/statistics/1661549-descriptive-inferential-statistics.
“Descriptive & Inferential Statistics Assignment”, n.d. https://studentshare.org/statistics/1661549-descriptive-inferential-statistics.
  • Cited: 0 times

CHECK THESE SAMPLES OF Descriptive & Inferential Statistics

Descriptive and Inferential Statistics

 In the essay “Descriptive and inferential statistics” the author analyzes statistics as a mathematical method which aid in the processing of pertinent information and decision making.... This application provides methodological tools and is divided into two main areas: The Descriptive Statistics and inferential statistics.... On the other hand, inferential statistics as the name implies is purposely to draw conclusions as well as to draw inferences, or to generate predictions on a given population derived from sample data....
2 Pages (500 words) Essay

Inferential and Descriptive Statistics

hellip; The author states that in order to undertake inferential statistics changes should be made in the analysis of the data, frequencies should be recorded for the gender, for the right-handed or left-handed variable and for the preferred T-shirt variable which should be treated as a dummy variable, for the income, age and grade variable.... Finally, in order to undertake inferential statistics, the sampling method should be random, this involves selecting an appropriate method that will ensure that data is reliable....
2 Pages (500 words) Essay

Statistics/Analysis - Descriptive and Inferential Presentation

Figure 1 presents the mean and standard deviation as two of the three descriptive measures used in the first part of the statistical analysis.... The owner of the Original Italian Pizza restaurant chain would like to understand which variable most strongly influences the sales of his specialty, deep-dish pizza....
5 Pages (1250 words) Essay

Descriptive or Inferential Statistics

he author sprinkles statistics throughout the news piece.... To set up the section on why Catholic schools are not the answer to struggling The Use of statistics in a News Article The article “Education—Answered Prayers” was published on the National Journal Magazine website d August 16, 1997.... The author sprinkles statistics throughout the news piece.... These statistics support the argument that Catholic schools are not the answer for every child....
2 Pages (500 words) Essay

Descriptive and Inferential Statistics Paper

Descriptive statistics are a summarized and simplified Descriptive and inferential statistics Affiliation: Descriptive statistics is thedescription, analysis and the summarizing of the analyzed data in such a way that a meaningful pattern of data and results is achieved.... inferential statistics can also be defined as a set of mathematical procedures that use probability technique to draw conclusion on already collected data about a given population.... inferential statistics are a branch of statistics that build on data summarized through descriptive statistics to make conclusions by use of probability and predictions (Healey, 2011)....
1 Pages (250 words) Research Paper

Differences Between Descriptive and Inferential Statistics

Either one or… This essay seeks to examine the differences that exist between the two statistics methodologies: descriptive and inferential statistics. ... This essay seeks to examine the differences that exist between the two statistics methodologies: descriptive and inferential statistics.... On the other hand, from the meaning of the word inference, inferential statistics is the process of reaching a conclusion regarding a parameter....
2 Pages (500 words) Essay

Descriptive Statistics, Inferential Statistics

statistics is the study of learning from data, and for measuring, communicating uncertainty and controlling, and it thereby gives the navigation significances for controlling the scientific and societal advances course.... Individuals working with statistics use statistical methods… and thinking to a broad range of social, scientific, and business endeavors in such areas as biology, economics, astronomy, education, marketing, engineering, psychology, genetics, marketing, sports, public health and many others....
4 Pages (1000 words) Admission/Application Essay

Descriptive and Inferential Statistics

The paper “Descriptive and inferential statistics” looks at a strict liability rule, which dictates that the owner of a company should take responsibility for any damages caused by his or her products.... Under a strict liability rule, the optimal decision for Ford will depend on the expected loss....
2 Pages (500 words) Assignment
sponsored ads
We use cookies to create the best experience for you. Keep on browsing if you are OK with that, or find out how to manage cookies.
Contact Us