StudentShare
Contact Us
Sign In / Sign Up for FREE
Search
Go to advanced search...
Free

The Connection between Hat Size and Intelligence - Coursework Example

Cite this document
Summary
"The Connection between Hat Size and Intelligence" paper states that there is some degree of connection between head circumference and vocational status. However, this connection is pretty small, with the mean head circumference responsible for only 4% of the variation in vocational status…
Download full paper File format: .doc, available for editing
GRAB THE BEST PAPER93.8% of users find it useful
The Connection between Hat Size and Intelligence
Read Text Preview

Extract of sample "The Connection between Hat Size and Intelligence"

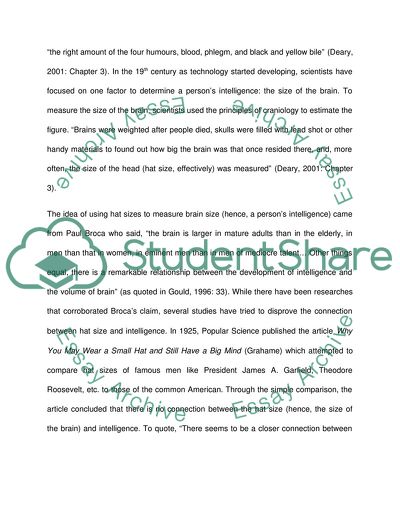
The Connection Between Hat Size and Intelligence Introduction There are many definitions of intelligence. For Howard Gardner proponent of the Multiple Intelligences Theory, intelligence be defined as “the capacity to solve problems or fashion products that are valued in one or more cultural settings” (Gardner & Hatch, 1989: 5). Yet, one has to realize that this definition came only in the early 1980s. In the days of antiquity, intelligence has always been connected with a person’s ability to score high in exams of the capability to perform well in school. Using this second definition of intelligence, people were classified as “prodigies, idiot savants, autistic” (Gardner, 1983: 48) among others. While Gardner has already proven that man have different capacities for processing information, schools today continue to focus on language and locigal-mathematics as a measure of a child’s scholastic success. However, for the purpose of clarity, these capabilities which can be measured through mental test questions are now referred to as psychometric intelligences. Other intelligences mentioned by Gardner include capacities in music, visual-spatial conceptualization, bodily-kinesthetic skills, knowledge of other persons, knowledge of ourselves (Gardner, 1983: 48). Hat Sizes, Brain Sizes and Intelligence Over the years, new studies attempting to discover the origin of intelligences of have been launched, but despite these researches, our knowledge of the topic is still incomplete. From the beginning, however, intelligence has been related with the brain. In the 1500s, Greek and Roman philosophers thought that the more efficient brain had “the right amount of the four humours, blood, phlegm, and black and yellow bile” (Deary, 2001: Chapter 3). In the 19th century as technology started developing, scientists have focused on one factor to determine a person’s intelligence: the size of the brain. To measure the size of the brain, scientists used the principles of craniology to estimate the figure. “Brains were weighted after people died, skulls were filled with lead shot or other handy materials to found out how big the brain was that once resided there, and, more often, the size of the head (hat size, effectively) was measured” (Deary, 2001: Chapter 3). The idea of using hat sizes to measure brain size (hence, a person’s intelligence) came from Paul Broca who said, “the brain is larger in mature adults than in the elderly, in men than that in women, in eminent men than in men of mediocre talent… Other things equal, there is a remarkable relationship between the development of intelligence and the volume of brain” (as quoted in Gould, 1996: 33). While there have been researches that corroborated Broca’s claim, several studies have tried to disprove the connection between hat size and intelligence. In 1925, Popular Science published the article Why You May Wear a Small Hat and Still Have a Big Mind (Grahame) which attempted to compare hat sizes of famous men like President James A. Garfield, Theodore Roosevelt, etc. to those of the common American. Through the simple comparison, the article concluded that there is no connection between the hat size (hence, the size of the brain) and intelligence. To quote, “There seems to be a closer connection between the size of a man’s body and the size of his brain than there is between the size of his brain and the power of his mind” (Grahame, 1925: 16). While Arthur Grahame’s article has shown early on that a person’s hat size cannot be used to measure his intellect, his claims were not readily accepted because he did not use statistical analysis to prove his point. H.T. Epstein utilized data on the head circumferences of white Bostonians and their vocational status to show that there is no correlation between these two variables. Research Goal, Problem Statement and Hypothesis The main research question for this paper is: Does a person’s head circumference determines his or her vocational status? Null hypothesis is H0= mean head circumference of the different groups are equal to each other. Epstein’s original table is reproduced in table 1 below. Table 1: Mean and Standard Deviation (in mm) of Head Circumference for People of Various Vocational Status VOCATIONAL STATUS N MEAN SD Professional 25 569.9 1.9 Semiprofessional 61 566.5 1.5 Clerical 107 566.2 1.1 Trades 194 565.7 0.8 Public Service 25 564.1 2.5 Skilled Trades 351 562.9 0.6 Personal Services 262 562.7 0.7 Laborers 647 560.7 0.3 Vocational status in this study is regarded as a measure of a person’s intellectual capacity. When a person is intelligent, the assumption is that he or she can gain better employment opportunities. By looking at the descriptive statistics from table 1, one can say that Broca’s claim that hat size and a person’s intellectual capacity are related. Yet, one question arises, what kind of relationship do these two variables have? Through the one-way ANOVA, one can get a better understanding of the statistics shown here. Instructions for this paper notes that the column labeled SD in table 1 is not really the standard deviation but rather the standard error. Hence, there is a need to recomputed the ANOVA table. Moreover, it is important to discover the variance and standard deviation for the table above to see how each subject in a group compares to the other. Meanwhile, the new ANOVA table can discover how one group compares with the others and the Tukey Kramer’s Procedure allows the researcher to discover which of the groups differ from each other. Because only the sample means are available for recomputation, the researcher has to result to calculator work to compute the variance and standard deviation. To compute the ANOVA table, the researcher utilized an online service (http://statpages.org/anova1sm.html). Tukey’s Honesty Significant Difference (HSD) was also computed manually. Discussion and Analysis Computing for Standard Deviation and Variance The standard deviation utilized for table 1 above is actually the standard deviation (SD) of the means. For the purpose of clarity the SD column in table 1 will be relabeled as SE. Because only the summary data was available, standard deviation cannot be computed directly, hence, the researcher computed for variance first. To compute for SD, we assume that SD = σ2. Because the only known values are σM and N, the following formula was tweaked where σM = standard error of the mean σ = standard deviation of the original distribution N = sample size The formula used for variance is now: and SD = Table 2 below is an expanded version of table 1. It shows the huge discrepancy in the variance and SD among the respondents, hence, one can already doubt the connection between head circumference and vocational status. With SD at 10, one can say that the variance of head circumferences in the group is huge, hence the reliability of hat size as a measure of intelligence can be doubted. If the SD and variance already provides an insight into the connection between the variables, ANOVA is able to determine whether or not the head circumference means of different vocational status are different from each other. Table 2: Vocational Status, Population, Mean Head Circumference, Variance and SD VOCATIONAL STATUS POPULATION MEAN SE VARIANCE SD (1) professional 25 569.9 1.9 1187.50 34.46 (2) semiprofessional 61 566.5 1.5 5581.50 74.71 (3) Clerical 107 566.2 1.1 12593.90 112.22 (4) Trades 194 565.7 0.8 30108.80 173.52 (5) public service 25 564.1 2.5 1562.50 39.53 (6) skilled trades 351 562.9 0.6 73920.60 271.88 (7) personal services 262 562.7 0.7 48050.80 219.20 (8) Laborers 647 560.7 0.3 125582.70 354.38 Computing For the F-Test Statistic Table 3 below shows a recomputed ANOVA table using the original SD column and as the standard error. From table 3 below, one can already see that F (7,1664) = 11.1833, p Read More
Cite this document
  • APA
  • MLA
  • CHICAGO
(The Connection between Hat Size and Intelligence Coursework Example | Topics and Well Written Essays - 1500 words - 1, n.d.)
The Connection between Hat Size and Intelligence Coursework Example | Topics and Well Written Essays - 1500 words - 1. https://studentshare.org/statistics/1769292-hat-size-and-intelligence
(The Connection Between Hat Size and Intelligence Coursework Example | Topics and Well Written Essays - 1500 Words - 1)
The Connection Between Hat Size and Intelligence Coursework Example | Topics and Well Written Essays - 1500 Words - 1. https://studentshare.org/statistics/1769292-hat-size-and-intelligence.
“The Connection Between Hat Size and Intelligence Coursework Example | Topics and Well Written Essays - 1500 Words - 1”. https://studentshare.org/statistics/1769292-hat-size-and-intelligence.
  • Cited: 0 times

CHECK THESE SAMPLES OF The Connection between Hat Size and Intelligence

Puppies, Pigs, and People eating meat and marginal cases

The author gives some differences between Fred and an average consumer of meat, as well as possible defenses that one could use to justify their meat eating habits as being different to Fred's fetish.... This paper is a discussion of two arguments based on the article, “Puppies, Pigs and People eating meat and marginal cases”....
5 Pages (1250 words) Essay

Interpersonal Communication and the Twilight Zone

Their ideas transcended this, and the implication was that this kind of communication was only possible between people who had not transformed.... Interpersonal Communication and the Twilight Zone - “Number 12 Looks Just Like You” Brief Overview of the Story In the episode “Number 12 Looks Just Like You,” Marilyn is a young girl, just turned 18, and is living in a world where everybody is, quite literally, perfect....
9 Pages (2250 words) Essay

Creativity and mentall illness, is there a link

Some others believe that though intelligence is required for creativity, it is not sufficient enough.... intelligence is only a part of creativity and in order to become a creative person one should have other qualities like great imaginative power.... (Waddell) Kamala Das (Madhavikutty), one of the greatest creative writers from Kerala, India has been passed away recently and her life history is one of the best examples for our topic of “relation between mental health and creativity”....
5 Pages (1250 words) Essay

How Different from Monkeys Are We Truly

I think that this art was probably less important than Tattersall makes it out to be, and the connection between early geometric art and written language which came hundreds of thousands of year later.... From the paper "How Different from Monkeys Are We Truly" it is clear that Gould tended to entirely dissociate brain size and shape from intelligence, whereas Tattersall indicates that increases in brain size were associated with increases in intelligence amongst developing homo sapiens....
2 Pages (500 words) Essay

Quantitative Methods for Business

This research paper “Quantitative Methods for Business” tries to find out the causes of variation in brain intelligence.... Lastly, Epstein in his research tries to oppose Hooton, by implying that there is no clear connection in intelligence compared to the head size but found a slight connection in the two.... The main purpose of the research paper is to establish the intelligence measure.... It studies on how one's intelligence can be measured and by use of what methodology....
7 Pages (1750 words) Assignment

The Rising Cost of IMINT and a Future Prospectus

Regardless of the metric that is analyzed, it is without question that the growth, proliferation, and constant change of technology have provided a definitive and measurable impact with respect to the way in which military intelligence is conducted.... A litany of examples of… exists with regard to this dynamic; however, the one that will be analyzed and discussed in depth in this particular analysis is contingent upon the changes with respect to technology, and the corresponding costs associated with this, that are related to image intelligence Whereas all types of intelligence that can be gathered has a distinctive purpose and subset of potential users, the growth and proliferation, as well as increasing extent of cutting-edge technology, has created a situation by which IMINT faces a fundamental crisis....
8 Pages (2000 words) Research Paper

Jonathan Pollard - the USA Intelligence Agent of Jewish Descent

The paper "Jonathan Pollard - the USA intelligence Agent of Jewish Descent" states that the prosecution of Pollard began in 1985 and he was eventually charged with the single offence of releasing defence intelligence to a foreign government (Shaw, 2001).... nbsp;… Despite the fact that Jonathan Pollard was set to be charged for multiple counts of criminal activities related to spying and leakage of intelligence information, the counts were reduced to that single one, since the actual nature of the information Pollard released to the Israel intelligence still remains vague....
5 Pages (1250 words) Research Paper

Intelligent Micromouse

hellip; The foremost features of the device are that its operating voltage ranges between 4.... Its range of measuring distance is between 4cm to 30cm and has an output type of analog voltage.... The paper "Intelligent Micromouse" highlights that the sensor cable of Intelligent Micromouse should be about 30cm in maximum length....
9 Pages (2250 words) Essay
sponsored ads
We use cookies to create the best experience for you. Keep on browsing if you are OK with that, or find out how to manage cookies.
Contact Us