StudentShare

Our website is a unique platform where students can share their papers in a matter of giving an example of the work to be done. If you find papers
matching your topic, you may use them only as an example of work. This is 100% legal. You may not submit downloaded papers as your own, that is cheating. Also you
should remember, that this work was alredy submitted once by a student who originally wrote it.
✕
Free
Enzyme Kinetics and Inhibitors - Lab Report Example
Summary
The paper "Enzyme Kinetics and Inhibitors" highlights that in general, the rate of enzyme-catalyzed reaction depends on the concentration of the substrate as per the Michaelis-Menten equation and an inhibitor retards the rate of the enzyme-catalyzed a reaction…
- Subject: Biology
- Type: Lab Report
- Level: Undergraduate
- Pages: 4 (1000 words)
- Downloads: 0
- Author: augustus93
Extract of sample "Enzyme Kinetics and Inhibitors"
Experimental Study of Enzyme Kinetics and Inhibitors
Abstract
In this study the kinetics of enzyme catalyzed reaction has been investigated. The effect of substrate concentration and inhibitor on the rate of reaction has been studied. The findings are presented in this report.
Introduction
Enzymes are biomolecules, mostly proteins. These are very important constituent for any living being as they catalyze biochemical reactions. The molecule on which enzyme acts are termed as substrate and the enzyme converts the substrate into product. Enzyme kinetics is concerned with the relationship of enzyme activity and substrate and product concentrations. The investigation of the kinetic properties on an enzyme provides important insight about the reaction mechanism and metabolic properties and function. Therefore, it is very important to investigate the kinetics of an enzyme to understand its role in different biochemical reactions of importance including metabolic reactions. In this study the relationship between initial rates of reaction and the concentration of one of the substrates, acetyl-CoA has been investigated. Effect of an inhibitor of the reaction, propionyl-CoA has also been investigated.
Theory
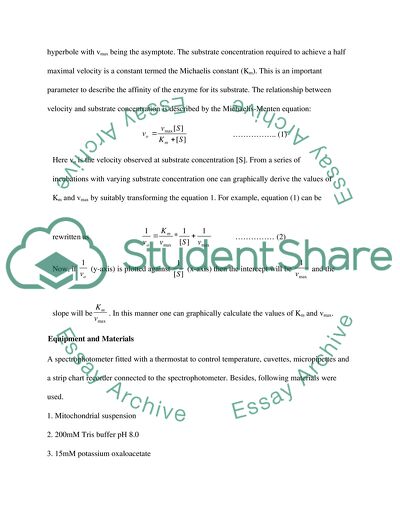
The rate of a reaction catalyzed by an enzyme depends upon the concentration of substrates as well as the physical conditions; temperature, pH, ionic strength, the concentration of co-factors etc. Increasing substrate concentrations leads to increased rate of reaction until a maximum is reached. In this state the enzyme is said to be saturated with the substrate. The relationship between initial velocity (vo) and substrate concentration ([S]) is described by a rectangular hyperbole with vmax being the asymptote. The substrate concentration required to achieve a half maximal velocity is a constant termed the Michaelis constant (Km). This is an important parameter to describe the affinity of the enzyme for its substrate. The relationship between velocity and substrate concentration is described by the Michaelis-Menten equation:
…………….. (1)
Here vo is the velocity observed at substrate concentration [S]. From a series of incubations with varying substrate concentration one can graphically derive the values of Km and vmax by suitably transforming the equation 1. For example, equation (1) can be rewritten as …………… (2)
Now, if (y-axis) is plotted against (x-axis) then the intercept will be and the slope will be. In this manner one can graphically calculate the values of Km and vmax.
Equipment and Materials
A spectrophotometer fitted with a thermostat to control temperature, cuvettes, micropipettes and a strip chart recorder connected to the spectrophotometer. Besides, following materials were used.
1. Mitochondrial suspension
2. 200mM Tris buffer pH 8.0
3. 15mM potassium oxaloacetate
4. 1.5mM acetyl-CoA
5. 3mM dinitrothiobenzoic acid
6. 0.3% (w/v) triton X-1 00
7. 15mM propionyl-CoA
Experimental Procedure
1. Spectrometer, water bath and strip chart recorder were switched on and allowed to warm up for 5minutes and in the meantime the required chemicals, consumables and accessories were checked.
2. Sectrophotometer was set at zero and the chart recorder was set at 5% full scale deflection. 3. Polarity of the connection to the strip chart recorder was checked and by interrupting the light path and getting a corresponding positive response from the strip chart recorder.
4. Chemicals in the following table was added to a 3.0 ml cuvette as per indicated volume and concentration.
Sl. No.
Component
Volume
Final Concentration
1
Tris buffer
1.5ml
100m M
2
Acetyl-CoA
100µl
50µM
3
Dithionitrobenzoic acid
100µl
100µM
4
Mitochondrial suspension
100µl
10-15 µg protein
5
Triton X-100
100µl
0.01 % (w/V)
6
Water
1 ml
5. The cuvette was placed in the thermostatted cell holder in the spectrophotometer; the lid was closed and after five minute the strip chart recorder was started. The strip chart paper was marked suitably for identification.
6. The lid was opened and 100 µl potassium oxaloacetate solution (final concentration 0.5mM) was added and monitoring of absorbance at 412nm was continued. Absorbance range corresponding to 90% FSD and the chart speed was noted.
7. This experiment was repeated and the initial rate of reaction (nmol.min-1) was calculated assuming a molar extinction coefficient of 13.6 X 10³ M-1.cm-1.
8. Steps 3-7 were repeated using 10 µl, 20 µl, 30 µl, 40 µl, 50 µl, 75 µl acetyl-CoA and the remaining volume was made up was adding water.
9. Repeat 8 in the presence of 100 µl propionyl-CoA (final concentration 0.5mM).
Calculation of Results
Concentration of the acetyl-CoA was calculated as by dividing its volume by the total cuvettes volume (3 ml) and multiplying the resulting value with the concentration of the original acetyl-CoA solution (5 mM). The rate of reaction was obtained by dividing the change in optical density of the solution with time, initial optical density and the molar extinction coefficient.
The values, thus calculated are presented in table 1, below:
Table 1: Concentration and Corresponding rate of reaction
Concentration (nM)
1/S
Rate of Reaction (nMmin-1)
1/vo
Rate of Reaction (nMmin-1)
1/vo
16.66667
0.06
3.31712E-06
3.01E+05
2.871E-06
348311.1
33.33333
0.03
6.63423E-05
1.51E+04
4.64396E-06
215333.3
83.33333
0.012
7.07014E-05
1.41E+04
1.10065E-05
90855.56
166.6667
0.006
3.5497E-05
2.82E+04
1.27088E-05
78685.71
250
0.004
0.000136202
7.34E+03
1.3342E-05
74951.11
333.3333
0.003
0.000104914
9.53E+03
1.91061E-05
52339.39
The inverse of the reaction rate was plotted against inverse of the substrate concentration. The graph is shown in figure 1, below:
Discussion
It can be seen from figure 1 that the relationship between 1/vo and 1/[s] is linear in agreement with the Michaelis-Menten equation. There is parallel upward shift in the curve in presence of the inhibitor propionyl-CoA. This is because the inhibitor is a competitive inhibitor. This means that the substrate acetyl-CoA and the inhibitor propionyl-CoA are competing for the same enzyme.
Acetyl-CoA reacts with oxaloacetate to form citrate (http://banon.cshl.edu). Therefore, varying the concentration of oxaloacetate will vary the rate of reaction. If this variation is done in a systematic manner and the rate of reaction is investigated then one can calculate the order of the reaction. As citrate is the product of this reaction, therefore, if citrate was present in the reaction, before the reaction started, then the rate of reaction will be slow in agreement with Le-Chatelier’s principle.
Conclusion
From this investigation it can be concluded that rate of enzyme catalyzed reaction depends on the concentration of the substrate as per Michaelis-Menten equation and an inhibitor retards the rate of the enzyme catalyzed reaction.
Reference
http://www.biochemj.org/bj/398/0107/3980107.pdf
http://en.wikipedia.org/wiki/Enzyme
http://banon.cshl.edu/cgi-bin/eventbrowser?DB=gk_current&FOCUS_SPECIES=Arabidopsis%20thaliana&ID=502378&
Model data for Practical Class 4
Annexure 1
Enzyme activity in absence of Propionyl-CoA
Time(sec.)
Optical density at 412nm
Volume 5mM acetyl-CoA in incubations
10µl
20µl
50µl
100µl
150µl
200µl
0
0.133
0.133
0.156
0.174
0.149
0.164
10
0.134
0.153
0.181
0.188
0.195
0.203
20
0.136
0.168
0.213
0.233
0.215
0.234
30
0.139
0.178
0.235
0.265
0.249
0.271
40
0.141
0.189
0.259
0.28
0.292
0.307
50
0.147
0.2
0.283
0.322
0.317
0.344
60
0.151
0.21
0.303
0.349
0.344
0.387
70
0.153
0.218
0.324
0.379
0.379
0.425
80
0.155
0.226
0.343
0.405
0.413
0.461
90
0.156
0.229
0.36
0.431
0.451
0.498
100
0.156
0.233
0.377
0.485
0.479
0.535
110
0.156
0.236
0.39
0.509
0.505
0.573
120
0.156
0.237
0.405
0.537
0.538
0.613
130
0.156
0.238
0.414
0.554
0.567
0.648
140
0.156
0.239
0.424
0.578
0.6
0.68
150
0.156
0.239
0.431
0.6
0.629
0.717
160
0.156
0.239
0.438
0.619
0.654
0.75
170
0.156
0.239
0.441
0.637
0.689
0.788
180
0.156
0.239
0.444
0.654
0.713
0.821
Enzyme activity in presence of Propionyl-CoA
Time(sec.)
Optical density at 412nm
Volume 5mM acetyl-CoA in incubations
10µl
20µl
50µl
100µl
150µl
200µl
0
0.461
0.475
0.481
0.486
0.496
0.508
10
0.464
0.48
0.493
0.5
0.511
0.53
20
0.466
0.485
0.503
0.518
0.522
0.559
30
0.469
0.488
0.513
0.529
0.535
0.577
40
0.471
0.492
0.523
0.543
0.558
0.6
50
0.475
0.498
0.533
0.559
0.563
0.629
60
0.477
0.503
0.543
0.571
0.578
0.65
70
0.478
0.507
0.552
0.585
0.592
0.676
80
0.481
0.512
0.563
0.6
0.606
0.7
90
0.483
0.514
0.574
0.613
0.618
0.725
100
0.485
0.519
0.578
0.627
0.633
0.747
110
0.487
0.524
0.587
0.641
0.645
0.77
120
0.49
0.527
0.595
0.653
0.66
0.795
130
0.491
0.531
0.603
0.666
0.673
0.814
140
0.493
0.535
0.61
0.679
0.688
0.837
150
0.495
0.538
0.618
0.693
0.7
0.864
160
0.497
0.54
0.626
0.705
0.712
0.885
170
0.499
0.543
0.633
0.716
0.726
0.905
180
0.5
0.546
0.639
0.727
0.739
0.926
Read
More
sponsored ads
Save Your Time for More Important Things
Let us write or edit the lab report on your topic
"Enzyme Kinetics and Inhibitors"
with a personal 20% discount.
GRAB THE BEST PAPER
