StudentShare
Contact Us
Sign In / Sign Up for FREE
Search
Go to advanced search...
Free

Rolling Cylinders - Lab Report Example

Cite this document
Summary
This lab report "Rolling Cylinders" is aimed at investigating the effect of relevant variables on time (T) taken by a cylinder (hollow as well as solid) while rolling down on an incline…
Download full paper File format: .doc, available for editing
GRAB THE BEST PAPER98.2% of users find it useful
Rolling Cylinders
Read Text Preview

Extract of sample "Rolling Cylinders"

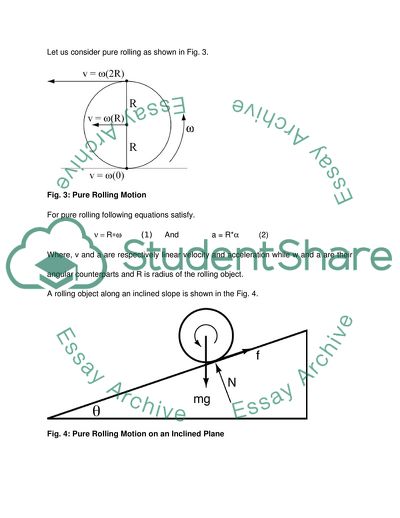
Rolling Cylinders Objective The experiment is aimed at investigating the effect of relevant variables on time (T) taken by a cylinder (hollowas well as solid) while rolling down on an incline. Theory When a cylinder rolls down an inclined surface (Fig. 1 and 2) it takes certain time (T) in travelling a length (L) along the incline. Value of this time is expected to depend on a combination of the following variables: (i) The distance travelled (L) and slope () of this inclined surface (ii) The dimensions of this cylinder like length (w), inner diameter (d) and outer diameter (D) (iii) The density () of the cylinder material (iv) The mass (m) and moment of inertial I) of the cylinder (v) Gravitational acceleration (g) This relationship may be either derived by using principles of mechanics. Fig. 1: A hollow cylinder Fig. 2: A Cylinder rolling on an inclined surface Time to Travel Distance L by Rolling Let us consider pure rolling as shown in Fig. 3. Fig. 3: Pure Rolling Motion For pure rolling following equations satisfy. R (1) And a = R* (2) Where, v and a are respectively linear velocity and acceleration while w and a are their angular counterparts and R is radius of the rolling object. A rolling object along an inclined slope is shown in the Fig. 4. Fig. 4: Pure Rolling Motion on an Inclined Plane From force balance, Torque (3) Also, , Therefore, (4) Therefore, (5) From, force balance, ma = mgSinq – f (6) Substituting the value of f from (5) in (6) we get (7) Now if the cylinder rolls down a distance ‘L’ along the slope; this problem is equivalent to travelling a distance ‘L’ with zero initial speed and acceleration ‘a’ as given by equation (7). Therefore, time of travel (T) will be (8) It should be noted here that moment of inertia for cylinders is given by the following expressions For solid Cylinder For Hollow Cylinder Where ‘r’ and ‘R’ are respectively inner and outer radius of the cylinder. Dimensional Analysis To carry out dimensional analysis, the fundamental dimensions of all the variables in equation (8) were inserted and it shows that equation (8) is dimensionally correct. Materials and Apparatus Following materials and apparatus were used in these experiments. (i) Hollow cylinders of 150 mm length and varying ID and OD to make hollow cylinders of different ID and OD by combination and also to make solid cylinder by combination. (ii) One inclined plane with facility to do coarse and fine variation in the angle of the slope. (iii) Angle measurement device (iv) Timing device Experimental Procedure All the cylinders and the inclined slope were kept clean all the times during these experiments. The angle of inclination was varied by the use of stepped block and finely by means of screw located under the track. The angle was measured by the use of clinometer. Distance travelled was measured using light beam and light beam sensor. Following measurements were made for a set of five hollow cylinders and one solid cylinder. (i) Time to travel distance ‘L’ vs. angle of inclination () (ii) Time to travel different distances ‘L’ for a given angle of slope () (iii) Time to travel distance ‘L’ vs. OD for ID = 0 (iv) Time to travel distance ‘L’ vs. OD for a fixed ID (v) Time to travel distance ‘L’ vs. ID for a OD Five measurements for time were recorded for each of these conditions and average value was taken and reported in this report. Results and Discussion Results from these experiments are presented in the following tables and graphs. Table 1: Time to travel distance ‘L’ vs. angle of inclination () Length L = 1.737 m Inclination (Deg.) Time to travel (s) 2.233 4.442 3.433 3.38 4.133 2.872 4.267 2.625 Time to travel certain distance ‘L’ on an inclined surface depends on the angle of inclination as reflected in table 1 and Fig.5. The time decreases with increasing angle of the slope. This observation is in conformity with equation (8) which predicts this inverse dependence as square root of sine of this angle. This also comes from common sense which will predict shorter time on a steeper incline and vice versa. Table 2: Time to travel distance ‘L’ vs. Distance Travelled for a fixed angle of inclination () Angle  = 4.133o Length (m) Time (s) 0.53 1.5816 1 2.218 1.4 2.5884 1.737 3.505667 From table 2 and Fig. 6, it can be seen that time to travel is increasing, provided all other variables remain the same. This is also expected. However, this dependence is not linear, which is also in conformity with equation (8). Table 3: Time to travel distance 1 m vs. Outer Diameter for a fixed angle of inclination () Solid Bar L = 1m  = 4.267o OD (mm) Time (s) 12.4 2.0512 20.55 2.0498 26.55 2.0492 36.75 2.0628 55.85 2.1234 68.65 2.277 Time to travel certain distance L is increasing with increasing outer diameter. This is because; increasing outer diameter increases moment of inertia and therefore, decreases the angular as well as linear acceleration. This is the reason why it takes longer to travel the same distance. Table 4: Time to travel distance 1 m vs. Outer Diameter for a fixed angle of inclination () and fixed ID = 26.55 mm Hollow Cylinder ID = 26.55 mm L = 1 m  = 4.267o OD (mm) Time (s) 36.75 2.1686 55.85 2.1746 68.65 2.2172 The trend here is similar to what has been seen in table 3 and Fig. 3. The reasons are also the same as offered in connection with table 3 and Fig. 3. Table 5: Time to travel distance 1 m vs. Inner Diameter for a fixed angle of inclination () and fixed OD = 26.55 mm Hollow Cylinder OD = 26.55 mm L = 1 m q = 4.267o ID (mm) Time (s) 0 2.0522 12.45 2.1086 20.3 2.2218 Time to travel certain distance ‘L’ shows an increasing trend with increasing inner diameter and vice versa. This is because, increasing inner diameter leads to increased moment of inertia and therefore, lower value of acceleration and hence longer time to travel. This effect is same as that of outer diameter. Conclusions These experiments explicitly demonstrate that time of rolling increasing angle of slope and decreases with increasing length and inner and outer diameter of the cylinder, while length of cylinder has no impact on time of travel of a rolling cylinder on an inclined surface. Title: The Vibrating Beam Objective The experiment is aimed at investigating the effect of relevant variables on periodic time (T) or frequency (F) of vibration of a cantilever beam. Theory A rectangular beam clamped at one end forms a cantilever. Let us consider a cantilever beam (Fig. 1) of width (b), thickness (d) and overhang length (L). This beam can be deflected slightly to cause vibration and frequency (F) of this vibration is expected to depend on the following variables: (i) Geometry of the cantilever beam defined by its width (b), thickness (d) and length (L) (ii) Stiffness of the cantilever beam as defined by its Young’s modulus (E) (iii) The density of this material (r) as in conjugation with geometrical variables, it determines mass of the cantilever beam (iv) Acceleration due to gravity (g) as the vibration takes place in gravitational field Stiffness of a cantilever beam is given by the following expression (1) Therefore, frequency (F) of vibration will be (2) Dimensional Analysis Putting the fundamental dimensions in the right hand side of equation (2) gives the same dimension (T-1) as that of frequency, supporting equation (2) as correct one. Materials and Apparatus Following materials and apparatus were used. (1) Apparatus to clam the beams with rectangular cross-sections (2) Nine mild steel beams, 1.3 m long and of different cross-sections (3) One brass and one aluminium beam (4) One timing reflective flag (5) One timing light and frequency meter (6) One magnetic stand for timing light Experimental Procedure The cantilever beam was fixed between two clamps using wing nuts. At the fixed end of the beam, the lighting flag was attached. The timing light was positioned in a manner that the small circle of light was just cutting one edge of the timing flag under vibrating conditions. The amplitude of the vibration was kept small. Following measurements were made and recorded. (i) Frequency of vibration (F) vs. width (b) of the beam (ii) Frequency of vibration (F) vs. thickness (d) of the beam (iii) Frequency of vibration (F) vs. vibrating length (L) of the beam (iv) Frequency of vibration (F) for brass and aluminium beams Five measurements of frequency of vibration were made for each of the conditions and the average value was taken and reported. Results The effect of beam width (b) and thickness (d) are presented in Table 1 and also in Fig. 1 and Fig. 2 respectively. Table 1: Effect of beam width and thickness on frequency of vibration of a cantilever beam (Length L = 1.3 m and material is MS) Width (b) mm Frequency (F) Hz Thickness (t) mm Frequency (F) Hz 12 8.6932 2.9 8.85012 16 8.7892 4.7 14.2936 20 9.0396 4.9 14.9786 25 8.917 5.8 18.0604 30 8.8116 From table 1 and also from Fig. 1, it can be seen that beam width has no impact on the frequency of vibration of the cantilever beam. This is also expected because; width is not a variable in the direction of displacement. This is also expected from equation (2). From table 1 and also from Fig. 2 it can be seen that frequency of vibration increases linearly with thickness of the cantilever beam. This is also in conformity with equation (2) describing effect of thickness on the frequency of cantilever beam. Effect of hanging length (L) on the frequency of vibration of cantilever beam is shown in Table 2, below. Table 2: Effect of hanging length (L) on the frequency of vibration of a cantilever beam (Material MS, b = 20 mm, d = 2.9 mm) length (mm) Frequency (F) Hz 400 13.5632 500 6.2908 600 4.7244 700 3.6442 This dependence is also presented in Fig. 3. It can be seen from table 2 and also from Fig. 3 that frequency of vibration of a cantilever beam decreases with increasing hanging length and vice versa. This is also in conformity with equation (2). Effect of material on the frequency of vibration of a cantilever beam is shown in Table 3 and also in Fig. 4. Table 3: Effect of material on the frequency of vibration of a cantilever beam Material Frequency (F) Hz Al 18.5468 Brass 8.4528 Steel 6.2908 It can be seen that material of construction has profound effect on the frequency of vibration of a cantilever beam. This effect comes from the Young’s modulus (E) and density , which varies from one material to another. The frequency of vibration is directly proportional to square root of the ratio of Young’s modulus of elasticity to the density of the material as per equation (2). Conclusions Increasing thickness leads to increased frequency of vibration of a cantilever beam and vice versa, while the reverse is true for increased hanging length and width of the beam has no impact on the frequency of vibration of a cantilever beam. The frequency of vibration is directly proportional to the square root of the modulus of elasticity and inversely proportional to the square root of density of the beam material. Title: The Vibrating Spring Objective These experiments are aimed at exploring the effect of relevant variables on the periodic time (T) or frequency of vibration (F) of masses suspended from helical springs. Theory Masses attached to the free end of either a single spring or a combination of springs form mass – spring system. This system can be deflected to induce oscillations in harmonic or periodic manner. The frequency of vibration is expected to depend on the following variables. (i) Mean diameter of the spring (D), diameter of the wire (d) and number of coils (n) as these variables define the geometry of the spring. (ii) The relevant material property, the modulus of rigidity (G) (iii) The vibrating mass (m), suspended from the free end of the spring Theoretically, the frequency of vibration of a spring – mass system is given as (1) Where k is stiffness of the helical spring and is given by (2) Where G is modulus of rigidity of the spring material, d is wire diameter, D is average coil diameter and n is number of turns. Material and Apparatus Apparatus consisted of arrangements to hang springs by its one end and masses at the other end of the spring. Frequency of vibration was measured with the help of an optical detector. Besides, following materials and instruments were also used. (i) Ten close coiled springs made of steel, details of the springs in table 1 (ii) One weight hanger with timing reflective flag (iii) One timing light and frequency meter Table 1: Details of the springs used in this experiment Spring Indent Wire d (mm) Mean Diameter D (mm) No. of Coils (n) Spring Mass (kg) A 4.88 57.2 17 0.47 B 4.88 57.2 15 0.42 C 5.98 57.2 10 0.42 D 4.88 57.2 12 0.34 E 4.06 57.2 12 0.24 F 4.88 57.2 8 0.23 G 3.25 57.2 8 0.10 H 4.06 44.5 16 0.25 K 4.06 37.6 18 0.24 N 4.06 31.8 20 0.22 Mass of weight hanger and Timing Flag = 0.3 kg Experimental Procedure The spring was suspended from the upright rig and a weight hanger was attached to the free end. Different masses were positioned on the weight hanger and subsequently deflected to cause vibration in the mass – spring system. The timing flag was adjusted to the one end of the flag, when under vibrating conditions. The amplitude of vibration was kept small and care was taken to avoid double counting of frequencies. Sufficient deflection was given to ensure proper operation of the frequency meter and following measurements were made. (i) Frequency (F) vs. suspended mass (ii) Frequency (F) vs. number of coils in the spring (n) (iii) Frequency (F) vs. wire diameter (d) (iv) Frequency vs. mean diameter of the spring coil (D) The measurements were recorded and used for further analysis. Results and Discussion (i) Frequency (F) vs. suspended mass Effect of mass on the frequency of mass-spring system is presented in table 2 for two springs A and B. Table 2: Effect of mass on frequency for two springs A and B Spring A, n = 17 Spring B, n = 15 Mass (lb) Frequency (Hz) Mass (lb) Frequency (Hz) 5 4.363 5 4.856 10 3.013 10 3.242 15 2.423 15 2.68 20 2.191 20 2.344 25 1.916 25 2.105 This variation is graphically presented in Fig. 1. From Table 2 and Fig. 1, it can be seen that frequency of the spring – mass system is decreasing with increasing mass and vice versa. Also for a given mass, frequency of a mass – spring system decreases with decreasing number of turns in the spring. These observations are confirming to the theoretical equation described in equation (1) and equation (2). (ii) Frequency (F) vs. number of coils in the spring (n) For this comparison only those springs were chosen which were identical in all respects except number of turns, n. Four springs A, B, E and F qualified under this criterion. Effect of number of turns on the frequency of mass-spring system is presented in table 3 for five different suspended masses. Table 3: Effect of number of turns on frequency of spring – mass system No. of turns Frequency, Hz 5LB 10LB 15LB 20LB 25LB 8 6.095 4.439 3.7 3.26 2.898 12 5.122 3.604 2.993 2.604 2.34 15 4.856 3.242 2.68 2.344 2.105 17 4.363 3.013 2.423 2.191 1.916 This is graphically represented in Fig. 2. It can be seen that frequency of oscillation of mass – spring system decreases with increasing number of turns and vice – versa. This is because increasing number of turns decreases stiffness (k) of a spring (equation (2)) and therefore, decreases frequency of the spring – mass system (equation (1)). (iii) Frequency (F) vs. wire diameter (d) For this analysis those springs were chosen which were identical in all respect except wire diameter. Only two such springs D and E meet this criterion. Therefore, frequency vs. mass plot was made for these two springs, which is presented in Fig.3. From this figure, it can be seen that frequency of spring mass system increases with increasing wire diameter. This is because increasing wire diameter, increases stiffness of the spring, which in turn increases frequency of the spring – mass system. (iv) Frequency vs. mean diameter of the spring coil (D) For this analysis springs with varying mean diameter, D; which were otherwise identical in all other aspect were required. But springs with such combinations were not available. Therefore, it was decided to accept the theoretical position that increasing mean diameter, D leads to decrease in the stiffness of a spring and therefore, decrease in the frequency of spring – mass system and vice – versa. Conclusions Based on these experiments it can be concluded that frequency of spring – mass system increases with increasing wire diameter, decreasing suspended mass, decreasing number of turns and decreasing mean diameter of the coil and vice – versa. Title: Hydrostatic Thrust on a Submerged Plane Surface Objective These experiments are aimed at experimental determination of the hydraulic thrust acting on a plane surface immersed in water and to determine the position of the line of action of the thrust and to compare the same with that determined by theoretical considerations. Theory When a surface is submerged in water it experiences a thrust by the displaced water. Value of this thrust can be calculated by Archimedes’ Law, and can be experimentally determined by an apparatus shown in Fig. 1. Fig. 1: Experimental set up for determination of thrust on a submerged plane surface Theoretical treatment for partly and fully submerged surface is presented in the following sections. (1) Partly Submerged Surface (a) Thrust on surface: Hydrostatic Thrust, F = gAh (Newtons) Where A = Bd and d = depth of immersion (Fig. 2 and Fig. 3) h = depth of the centroid, C = d/2 Hence, F = gBd2/2 (1) Fig. 2: Schematic arrangement for determination of line of thrust (b) Moment of thrust about pivot Moment = Fh’’ Where h’’ = depth of line of thrust (centre of pressure P) below pivot (c) Equilibrium condition: A balancing moment is produced by the weight (W) applied to hanger at the end of the balance arm = WL (Nm) For static equilibrium the two moments are equal i.e. Fh’’ = WL = mgL (m = applied mass) hence, h’’ = mgL/F = 2mL/(bd2) Experimental result, obtained by substitution for F from equation (1) (d) Theoretical result for depth of pressure, P, below free-surface h’ = Ix/(Ah) (2) where Ix = 2nd moment of area on immersed section about an axis in the free-surface. Ix = Ic + Ah2 (using paralled axes theorem) Ix = Bd3/12 + Bd(d/2)2 = Bd3/3 (3) (e) Depth of P below pivot point h’’ = h’ + H – d (4) By (3) in (2) and then into (4) yields h’’ = H – d/3 (2) Fully submerged vertical plane surface (a) Thrust on surface: Hydrostatic Thrust, F = gAh = gBD(d – D/2) (Fig. 4) (b) Moment of thrust about pivot Moment = Fh’’ (c) Equilibrium condition: Fh’’ = mgL hence, Experimental result, obtained by substitution for F from equation (1) (d) Theoretical result for depth of pressure, P, below free-surface h’ = Ix/(Ah) and Ix = BD{D2/12 + (d – D/2)2} (e) Depth of P below pivot point h’’ = h’ + H – d which yields Experimental Procedure The dimensions B and D of the quadrant end – face and the distance H and L were measured. An empty plastic tank was placed on a rigid, horizontal bench and the drain was put into the sink. A balance arm was placed on a knife edge. The drain valve was closed. The tank was leveled using adjustable feet and the spirit valve integrated with it. The counter balance weight was moved till the balance arm became horizontal. The 50 gm weight hanger was located in the groove at the end of the balance arm. Water was poured into the tankusing jug through the triangular aperture adjacent to the pivot point. Water was added till the hydrostatic thrust on the end – face of the quadrant started causing the balance arm to rise. It was ensured that there was no spill over of water on the upper surfaces and sides of the quadrant above the water level. Water was added till the arm became horizontal. Depth of immersion was read from the scale on the face of the quadrant. A single 50 gm mass was added to the weight hanger and the procedure was repeated for each increment in load produced by adding further mass to each hanger. This was repeated till the water level reached the top of the quadrant face. The experiment was repeated in the reverse direction by progressively removing the weights while the water was drained and attaining equilibrium at each stage. Results and Discussion Values of the useful parameter related to the apparatus are the following B = 75 mm; D = 71 mm; L = 279 mm and H = 215 mm Equilibrium water level corresponding to different values of the added weights is presented in Table 1. Table 1: Water level and the balancing weights Hydrostatic thrust Rising Water Level Falling Water Level MASS (g) Depth, d mm) Mass (gm) Depth d, (mm) Average Depth d (mm) 50 49 50 49 49 75 60 75 59 59.5 100 69 100 68 68.5 125 77 125 76 76.5 150 85 150 84 84.5 175 92 175 91 91.5 200 99 200 98 98.5 225 105 225 104 104.5 250 110 250 110 110 275 116 275 116 116 300 123 300 122 122.5 325 129 325 128 128.5 350 135 350 135 135 375 141 375 141 141 Values of thrust force and experimental and theoretical positions of the line of thrust were calculated corresponding to different water levels. These values are presented in Table 2, below. Table 2: Calculated values of thrust, and experimental and theoretical values of the location of thrust line with respect to the pivot line MASS (g) Depth(mm) Thrust, F (N) Position of Centre of Pressure (mm) Rising Falling Average Experimental Theoretical 50 49 49 49 0.88326788 154.935444 198.666667 75 60 59 59.5 1.30236947 157.615988 195.166667 100 69 68 68.5 1.72616147 158.559327 192.166667 125 77 76 76.5 2.14176825 159.738921 189.745935 150 85 84 84.5 2.55967425 160.390917 188.073129 175 92 91 91.5 2.925342 163.732394 187.001488 200 99 98 98.5 3.29100975 166.331321 186.167989 225 105 104 104.5 3.60443925 170.851194 185.588164 250 110 110 110 3.89174963 175.820021 185.138702 275 116 116 116 4.20517913 178.986965 184.718427 300 123 122 122.5 4.54472775 180.670228 184.328544 325 129 128 128.5 4.85815725 183.098592 184.017025 350 135 135 135 5.19770588 184.301791 183.721943 375 141 141 141 5.51113538 186.235899 183.481833 From this table it can be seen that thrust force increases with increasing depth of immersion. This happens because increase in column height leads to increase in thrust force in line with the equation P = gh. With increasing depth of immersion, the depth of centre of pressure should go on decreasing and this trend is exhibited in the theoretical position of the centre of pressure. However, the experimental values show a wide difference with the theoretical value and also the trend is opposite. This could be due to experimental error. Conclusion Based on these experiments it can be said that magnitude of the thrust force increases with increasing depth of immersion and also the depth of the centre of pressure shows opposing trend with the depth of immersion. Read More
Cite this document
  • APA
  • MLA
  • CHICAGO
(Rolling Cylinders Lab Report Example | Topics and Well Written Essays - 4000 words, n.d.)
Rolling Cylinders Lab Report Example | Topics and Well Written Essays - 4000 words. https://studentshare.org/engineering-and-construction/1745949-mechanical-engineering
(Rolling Cylinders Lab Report Example | Topics and Well Written Essays - 4000 Words)
Rolling Cylinders Lab Report Example | Topics and Well Written Essays - 4000 Words. https://studentshare.org/engineering-and-construction/1745949-mechanical-engineering.
“Rolling Cylinders Lab Report Example | Topics and Well Written Essays - 4000 Words”. https://studentshare.org/engineering-and-construction/1745949-mechanical-engineering.
  • Cited: 0 times

CHECK THESE SAMPLES OF Rolling Cylinders

Distillation- Gas Chromatography Investigations

Name Institution Date Introduction Distillation is the technique often used in separating liquid mixtures.... At a certain temperature, a pure liquid is known to have a specific vapor pressure (Harwood and Moody 145).... Thus, heating the liquid often provides extra energy to the molecules.... hellip; This energy is utilized by the molecules to change phase, that is, from the liquid phase into the gas phase....
4 Pages (1000 words) Lab Report

Comparative Analysis of Compact Cars

This Project Data Report is an analytical study of the compact car segment, covering aspects from price of the car and its resale value to its engine, performance, fuel efficiency, styling and other features.... The purpose of this research report is to enable people to understand the different variations of cars available in compact version....
8 Pages (2000 words) Research Paper

Compression Test on a Piper Aircraft Lycoming Engine

hellip; The author states that the Lycoming cylinders are serviceable approximately within 950 hours since the overhaul.... This includes the complete assembly of the steel cylinders including valves and pistons.... The cylinders can be removed and replaced with nitrited Lycoming cylinder assembly in order to upgrade horsepower to 160.... Compression Test on a Piper Aircraft Lycoming Engine The limitations for the differential compression check are discussed below:The pressure readings should be nearly equal for all cylinders with at least a difference of 5psi....
2 Pages (500 words) Research Paper

Car ignition system

Spark coil or ignition coil is used to transform the low voltage from a battery to thousands of voltage that are needed in order to create a spark to induce fuel ignition in an automobile ignition system.... The old coil ignition system requires a capacitor and a mechanical contact… The coils may rely on either external or internal resistors to control current flow from the battery supply....
4 Pages (1000 words) Assignment

The Automobile in American History and Culture

In the paper “The Automobile in American History and Culture” the author analyzes the development of the car engine, most of which portray dedicated technological improvements that succeeded in the modern day engine from the traditional engine invented hundreds of years ago.... hellip; The author explains that among the features that prove the difference are engine sizes, efficiency, power and supporting components among many others....
7 Pages (1750 words) Essay

Polyproplene and KRATON

The most advisable temperature range for cylinders are between 400- 570°F.... When it comes to thermoplastic structure, manufacturers are expected to deliver the ultimate in toughness, rigidity, and resistance in terms of handling thermal deformation.... INEOS O&P has created a polyproylene material that delivers those very material characteristics....
8 Pages (2000 words) Essay

Engineering analysis: Piston

Due to the high combustion temperatures of the cylinders, copper and nickel are used as the materials to help increase the tensile strength of the piston.... Due to the high combustion temperatures of the cylinders, copper and nickel are used as the materials to help increase the tensile strength of the piston....
2 Pages (500 words) Essay

Reciprocating Air Compressor

This paper 'Reciprocating Air Compressor" focuses on the product dissection of a compressor.... Compressors could be classified under two categories, namely positive displacement type and dynamic type.... The common compressors are the reciprocating, rotary screw, rotary centrifugal ones.... nbsp;… The inlet valves allow the air inside when the pressure inside the cylinder is less than the intake pressure....
6 Pages (1500 words) Case Study
sponsored ads
We use cookies to create the best experience for you. Keep on browsing if you are OK with that, or find out how to manage cookies.
Contact Us