StudentShare

Our website is a unique platform where students can share their papers in a matter of giving an example of the work to be done. If you find papers
matching your topic, you may use them only as an example of work. This is 100% legal. You may not submit downloaded papers as your own, that is cheating. Also you
should remember, that this work was alredy submitted once by a student who originally wrote it.
✕
Free
Economic Analysis of Success at the Olympic Games - Thesis Proposal Example
Summary
From the paper "Economic Analysis of Success at the Olympic Games" it is clear that generally, the modern Summer Olympic Games has become the world’s most significant sporting activity, and the number of participating countries has increased at each event. …
- Subject: Macro & Microeconomics
- Type: Thesis Proposal
- Level: Business School
- Pages: 20 (5000 words)
- Downloads: 0
- Author: keven96
Extract of sample "Economic Analysis of Success at the Olympic Games"
To participate or to win? An economic analysis of success at the Olympic Games Methodology and Data 3 Methodology Two different approaches will beapplied to show how those independent variables can affect a country’s ability to win medals at the Summer Olympic Games. The Cobb Douglas production function will be the main tool used to interpret the effectiveness of the input variables, while the fixed effect model will analyse the topic from many different perspectives. Through applying these separate methods to study the Olympic Games medal winning determinants, it will provide an understanding of the subject from different viewpoints. Specific details about how each method is used will be provided within this chapter.
3.1.1 Cobb Douglas Production Function
The first method to be used is the Cobb Douglas Production Function. This method considers a country through holding economic resources constant and by adding additional players participating at certain sports will eventually lead to a decrease in the quality of training, which of course is essential for players to achieve their full potential. Therefore, for any given amount of economic resources, the marginal rate of contribution of population to Olympic Games performance for any country is likely to decrease. In contrast, by holding the population constant, and as the number of people available to become sport professionals is fixed, additional income spend on Olympic sports will eventually create diminishing returns as a greater number of players reach their potential. All of the additional economic resources spent on average skilled athletes will not result in any extra medals for the participating country. The method of producing talented athletes is similar to the process of producing goods and services. Therefore, the Cobb Douglas Production Function has can be applied to determine the share of medals among nations taking part in the Olympic Games through using GDP (capital) and population (human resource) as the two critical production factors. Moreover, this approach takes into consideration other variables, such as a nation’s medal history, if that nation is the Olympic host, the nation’s neighbours and also political system. It is assumed that these factors do influence the medal count of a nation.
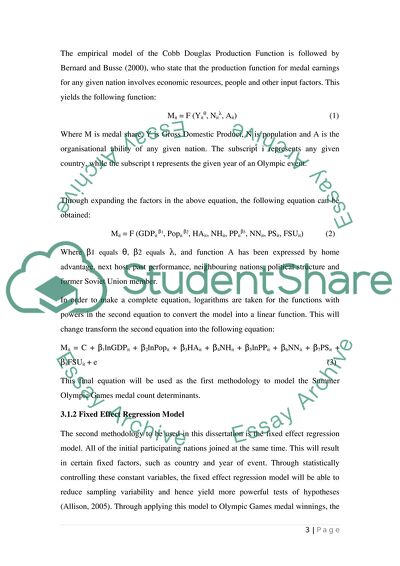
The empirical model of the Cobb Douglas Production Function is followed by Bernard and Busse (2000), who state that the production function for medal earnings for any given nation involves economic resources, people and other input factors. This yields the following function:
Mit = F (Yitθ, Nitλ, Ait) (1)
Where M is medal share, Y is Gross Domestic Product, N is population and A is the organisational ability of any given nation. The subscript i represents any given country, while the subscript t represents the given year of an Olympic event.
Through expanding the factors in the above equation, the following equation can be obtained:
Mit = F (GDPit β1, Popit β2, HAit, NHit, PPitβ3, NNit, PSit, FSUit) (2)
Where β1 equals θ, β2 equals λ, and function A has been expressed by home advantage, next host, past performance, neighbouring nations, political structure and former Soviet Union member.
In order to make a complete equation, logarithms are taken for the functions with powers in the second equation to convert the model into a linear function. This will change transform the second equation into the following equation:
Mit = C + β1lnGDPit + β2lnPopit + β3HAit + β4NHit + β5lnPPit + β6NNit + β7PSit + β8FSUit + e (3)
This final equation will be used as the first methodology to model the Summer Olympic Games medal count determinants.
3.1.2 Fixed Effect Regression Model
The second methodology to be used in this dissertation is the fixed effect regression model. All of the initial participating nations joined at the same time. This will result in certain fixed factors, such as country and year of event. Through statistically controlling these constant variables, the fixed effect regression model will be able to reduce sampling variability and hence yield more powerful tests of hypotheses (Allison, 2005). Through applying this model to Olympic Games medal winnings, the following model can be derived:
M = C + β1lnGDP + β2lnPop + β3HA + β4NH + β5NN + e (4)
From this equation it can be seen that the model structure is similar to the Cobb Douglas Production Function model. The medal share is the dependent variable, although some of the endogenous independent variables have changed. Firstly, past performance is not included in this model. This is primarily due to the concept that a country’s medal winning history is highly correlated with other explanatory variables. By removing previous a nation’s medal count from previous games, this will theoretically improve the explanation power of other related factors. Secondly, the factor of the year of event has been controlled specifically for the fixed effect regression model. Furthermore, the independent variables of political structure and former Soviet Union member have also been removed from the equation, as those were constant factors only with its associated countries.
3.2 Data
This dissertation will be restricted to the past five events of the Summer Olympic Games. Investigating earlier Summer Olympic Games events brings about a number of issues, largely through economic data meanings and definitions. Also, past Summer Olympic Games show an inconsistency in country attendance levels. This is largely due to political factors, such as the Cold War and the disjoint of Soviet Union, which caused an important effect on the Summer Olympic Games. As a result, participation levels in the 1976, 1980 and 1984 Games were significantly lower than usual. The fall of Soviet Union has led to measuring arguments for their previous medal earnings between its associated satellite countries. With this information being taken into account, to overcome such measuring difficulties and avoid biased data, this paper will only observe from the 1996 Atlanta Games onwards. The Winter Olympic Games has much fewer countries participating (naturally for climatic reasons), therefore this event has been removed from observations.
Two main components are contained in this paper: Olympic medal counts and associated independent variables. Olympic medal counts are directly obtained from the International Olympic Committee (IOC), which a dataset of both total medals and gold medals for all countries. Independent variables consist of economic, geographic, demographic and political indicators, which contain Gross Domestic Product, population size, home advantage, next hosting country, neighbouring nations, past performance, political structure and former Soviet Union members. Primary data sources were the World Bank, International Olympic Committee and United Nations. Any additional information was discovered through reliable public sources, such as the Taiwan Statistical Planning Book and other published journal articles. In theory, these are more appropriate measurements of the included independent variables. On the other hand, there are a number of difficulties for the data collection process. Additional detail in regards to potential limitations will be provided in later chapters.
Medal Share
This analysis will use medal share as a dependent variable. The total number of medals fluctuate each event, and observations are extended over a number of Games. Therefore it is much more appropriate to measure each country’s share of medals in a single event rather than the total figure.
LnGDP
It is expected that GDP will have a positive influence on medal winnings in Summer Olympic Games. With a higher level of GDP and income, a country would have potentially more resources to spend on hiring experienced sport coaches, build higher quality training facilities and have access to better medical care. As a result, this will dramatically increase the probability of producing high level athletes, which then leads to a better performance at the Olympic Games.
LnPop (Population)
The larger the population size of a country is, the more likely that country is going to win more medals at the Olympics Games. This variable is theoretically regarded as the most important factor to affect medal count, both in relation to significance and magnitude. With a larger population a nation can have more human resources to select from when sending athletes to the Olympic Games. As a result, it will increase the probability of discovering top quality players and thus achieving more medals. The advantage of extensive population size will also increase the participation rate of a country, which also allows a nation to participate in more sports at the Olympic Games. Taking this into account, the advantage of population size will likely give a country more medals.
HA (Home Advantage)
Host nations of the Summer Olympic Games are considered to have a number of potential advantages in regards to the other Olympic participants. This can be looked at from the view of the cost of taking part in the Olympics, which will be greatly minimized for individual athletes from the host country. In addition, host countries are better placed to tailor the facilities of their athletes so as to meet their needs; they may also enjoy home crowd enthusiasm, which may give them an edge over the rest of the field or sway the judges’ minds. Individual athletes have also been observed to be more motivated to do well in the Olympic Games when they are competing in front of their family and friends. In addition, host nations have been observed to add new sports to the event, thus giving them a comparative advantage over the rest of the nations.
NH (Next Hosting Country)
The host of an Olympic Games usually is awarded the right to stage the event seven or eight years before it is due to take place. This is a long-term process that gives time to produce high-quality athletes. Therefore, countries usually concentrate more specific sporting events shortly after the winning the hosting rights due to motivation. The purpose for a host nation is to achieve its full potential at its home games so the event can be popular among the locals. This extra amount of motivation and time spent preparing will also likely increase a country’s probabilities to win more medals at the Olympic Games preceding the even that country is due to host.
LnPP (Past Performance)
The past performance of a country also has a positive effect on the chances of Olympic medal success. Winning medals in the past can also provide a special experience for athletes and coaches alike. This is a unique advantage for the games because it will likely spur them on to greater success next time they compete at the Olympics Games. The phenomenon that the majority of medals are dominated by a small number of countries may also be explained by the factor of past performance. Since those countries have achieved impressive medal counts at previous events, it will serve as a motivator to raise their expectations to keep their ranking position or achieve more highly at the following event.
NN (Neighbouring Nations)
Neighbouring nations receive similar benefits to the hosting country in that it often costs less to send athletes to the event compared with other countries. Additionally, geographically related countries share similar cultures and environments. As a result, players will feel less nervous when they are attending an event in their neighbour country. The more confident a player is the more likely they will achieve better results at the Olympic Games.
PS (Political Structure)
Countries with different political structures tend to have different training systems and different attitudes to some sporting events. As a result, the amount of effort and resources put into the Olympic Games will also be different. For instance, a country that is under a constitutionalism political structure, such as the United States, maintains its position as the highest achieving nation in Olympic history. Communist countries, such as the former Soviet Union countries and China, were observed to perform better compared to the countries with similar national income levels. Due to these patterns, this variable is included in the model to see whether the political structure of a country matters to Olympic success.
FSU (Former Soviet Union Members)
The former Soviet Union countries have won more than 15 percent of the total medals at the last five Olympic events; however, they only contribute less than 3 percent to global GDP and make up 4.8 percent of the world’s population. The achievements of these countries are highly impressive (Olympic, 2013). The significance of this variable affecting the medal winnings at Olympic Games is strong enough to investigate further.
Results
4.1 Results of the Cobb Douglas Production Function
The statistics tables in Appendix 2 and 3 show the relevant information about the Cobb Douglas Production Function model. The value for R square is 64.9 percent, which indicates that approximately 65 percent of the variances can be explained by the model. The results from the ANOVA test show an F test value of 123.8 and a significance level of 0.000. These two figures show that the model is very strong in terms of statistical significance, and there is a clear link between the independent variables and dependent variables. All of the above figures confirm that the input variables do influence the medal winning abilities of any given country.
Results from Pooled OLS Model
Table 2
Model Coefficients
Unstandardized Coefficients
Standardized Coefficients
t
Sig.
B
Std. Error
Beta
(Constant)
-.031
.005
-5.911
.000
LogGDP
.001
.000
.074
2.545
.011
LogPopulation
.003
.001
.129
4.274
.000
HomeAdvantage
.040
.005
.214
8.097
.000
NextHost
.013
.005
.067
2.594
.010
LogPastPerformance
.021
.001
.637
20.763
.000
Neighbour
-.004
.001
-.088
-3.248
.001
PoliticalStructure
.005
.002
.063
2.279
.023
FormerSU
.005
.002
.085
3.273
.001
Dependent Variable: MedalShare
Table 2 displays the results from the third equation, which is the pooled OLS model based on the Cobb Douglas Production Function. From the above table it can be seen that all of the independent variables are statistically significant. This means that each of these factors influence the capabilities of a nation to win medals at the Olympic Games.
The impact of GDP and population with regards to the medal share is positive. Any increase in GDP, even as small as one percent growth, will result in an increase to the point medal share by approximately 0.074 percent, while one percent increase in population will lead to a rise in the medal share by 0.139 percent. Through interpreting these results, it can be found that population has a greater effect on medal winnings compared to GDP, both in terms of significance and magnitude. Population size has stood out as a fundamental determinant when it comes to medal success. However, one main setback of this variable is that many talented athletes typically do not participate for populated countries, as the number of participants each nation has is always restricted. High GDP and income provide countries with a chance to specialize in specific events that form a part of the Olympic Games, train athletes better, offer better medical services and have a larger team of athletes send to the Olympic Games. It is evident by looking at the history of the Olympic Games, especially in earlier events, where countries with abundant economic resources have participated in more events compared to countries with fewer economic resources. However, there is evidence to suggest that the medal winnings gap between developed countries and developing countries has reduced in recent Games (Johnson and Ali, 2000).
The variable of home advantage has a huge impact on medal winnings. The host country will, on average, be able to achieve a 21.4 percent greater medal share than other countries. Home advantage enables a nation to have more athletes at the event and enjoy greater support during the competition, minimal costs of participating in the event. All of these factors have a positive influence on the performance of home athletes. As a result, the host nation enjoys such merits to achieve a higher position in the medal ranking table.
Past performance is the strongest indicator when predicting medal counts, both in terms of significance and magnitude. This variable shows that the medal share a nation has earned in previous Olympic events will consequently influence the medals that the nation wins at the following Olympic Games by 63.7 percent. A good example is that if a nation comes up with a sophisticated training facility, this will not only payoff for the current event but also at the following events in the future. As such, past performance is strongly linked to medal share.
With regards to political factors, there is statistical evidence to suggest that single parity nations and former Soviet Union countries have performed better than expected at recent Olympic Games. Communist countries and central planning economies permit for more specialisation in terms of preparing for an event. In such a case, more national resources are set aside to support and train athletes compared to economies that are market-based. In addition, sporting events are normally considered to be instrumental in increasing national standing. Countries that make up the former socialist Soviet Union have also benefited from this system. The winning culture of a nation at the Olympic Games is a major contributor to future performance. As a result, being a single parity country or former Soviet Union member will increase associated medal share winnings by 6.3 percent and 8.5 percent respectively.
The p-value of 0.01 for the next host country has been proven statistically significant. The coefficient figure of 0.067 indicates that the next host nation will achieve better results at the current event, where it will donate an extra 0.067 medal shares to that country compare to the others. Australia performed significantly better at the 1996 Atlanta Games; Greece also doubled its medal tally at the Sydney Games in 2000.
With regards to neighbouring nations, there are some interesting results depicted from the model. When a country is located on the same continent as the host nation, on average the country receives 8.8 percent fewer medals compared to countries from outside the continent. This is the opposite of theoretical frameworks and previous research journals. This phenomenon could be explained by associations with the host country. Countries within the same continent are more likely to have conflicts with the host nation. In some cases, that history of conflict will spill over into the sporting arena. To some extent, these factors will raise the competition level between neighbouring nations and the host country. The home advantage of the host country will give the opposite effect for neighbouring nations. Also, when those neighbouring countries play against nations from other continents, the home crowd will often support the opposition. As a result, neighbouring countries will have fewer chances to win medals. On the other hand, the effectiveness of neighbouring nations is very small. If more input factors could be analysed and associated to the model, then more information can be received and the explanation will be more accurate.
4.2 Results of Fixed Effect Model
Results of Fixed Effect Model
Table 3
Equation 1
Equation 2
Equation 3
Variable
Coefficient[p-v]
const
-26.4118 [0.37]
-6.8172 [0.32]
-4.9768 [0.45]
LogGDP
1.0517
[0.20]
1.4087 [0.03]
1.2291 [0.036]
LogPopulation
3.31467
[0.50]
-
-
Home_Advantage
19.9228
[0.00]
19.9028 [0.00]
19.5927 [0.00]
Next_Host
4.5271
[0.1]
4.5076 [0.02]
4.6017 [0.01]
neigh
-0.4876 [0.31]
-0.5121 [0.28]
-
R squared
0.9529
0.9530
0.9530
ANOVA p-value
0.0000
0.0000
0.0000
ANOVA F test
58.7476
60.3479
60.4808
Equation 1
Table 3 displays the results from the Fixed Effect Regression model, which shows different outcomes from the Cobb Douglas Production Function model. The first equation of the Fixed Effect Model used all the independent variables included in the framework. One important finding from this model is that GDP, population and neighbouring nations have no effect on medal winnings. Home advantage and next host are largely effective for this model at a 99 percent confidence level; this suggests that being a host country or the next host country will result in an extra 19.9 percent and 4.5 percent increase in medals than other countries.
Equation 2
Variables that no longer affect the model, and those with the highest p value, have been removed from the first equation by applying backward elimination. For the second equation it can be seen that factors that are associated with the right to host the event remain as the dominant factors. Interestingly, GDP only becomes effective in this model after removing the population variable. One possible explanation is that the correlation between GDP and population is high, and by removing one of the variables there may be an increase in the significance level of another variable. For the purpose of significance test, LogGDP was deleted from the first equation to observe the p-value of the population variable. The outcome has shown that population has the associated p-value reduced from 0.5 to 0.07, which is still greater than the 95 percent significance level. Despite the fact that there is a clear linear relationship between GDP and population, removing population instead of GDP is statistically more sensible.
Equation 3
The variable of neighbouring nations was removed from the previous equation, and this is the final model, as all independent variables are significant at a p-value of
Read
More
sponsored ads
Save Your Time for More Important Things
Let us write or edit the thesis proposal on your topic
"Economic Analysis of Success at the Olympic Games"
with a personal 20% discount.
GRAB THE BEST PAPER
