StudentShare
Contact Us
Sign In / Sign Up for FREE
Search
Go to advanced search...
Free

Restaurants and Happiness/Life Satisfaction - Statistics Project Example

Cite this document
Summary
For any human, satisfaction towards food is an crucial question and issue. Does a man get proper food? Is it with right nutritional value? Is it caters to his satisfaction and worthwhile of money he paid. Above all, does he get satisfaction ultimately both physically and mentally…
Download full paper File format: .doc, available for editing
GRAB THE BEST PAPER92.5% of users find it useful
Restaurants and Happiness/Life Satisfaction
Read Text Preview

Extract of sample "Restaurants and Happiness/Life Satisfaction"

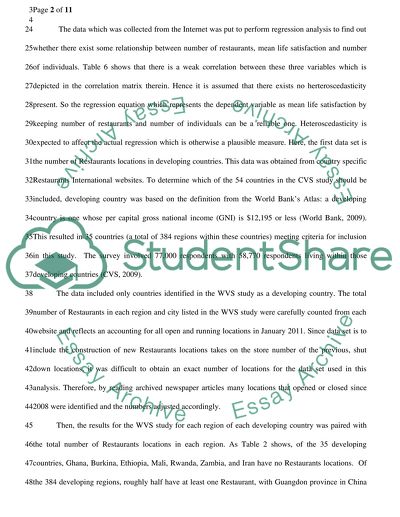
? WHAT I’ve written: I don’t think this is written correctly: Please edit/clarify/correct if needed For any human, satisfaction towards food is an crucial question and issue. Does a man get proper food? Is it with right nutritional value? Is it caters to his satisfaction and worthwhile of money he paid. Above all, does he get satisfaction ultimately both physically and mentally. So there are so many parameters involved in the study of satisfaction towards food. It may be influenced through restaurants of good quality, which can add to nutritional value and physical value. This study examines the of impact fast food restaurants in developing countries on individual life satisfaction and happiness of individual living in those developing countries. The locations of the restaurant are identified in undeveloped countries and used to determine whether individual life satisfaction in given regions which increases or decreases across parallel income brackets. Independent variables were identified from the World Value Survey of individuals living in undeveloped countries to measure happiness/life satisfaction. This cluster of variables which are called subjective utility variables in this study, were used to support the Life Satisfaction score as it relates to happiness. The fixed effects OLS model is used as control for the number of restaurants in each region, to test the impact whether there is a restaurant or not in a region and to determine the effect of additional the restaurants on individual life satisfaction and happiness. For the purpose of this research, the relationship between the LIFE SATISFACTION score and the data associated with 12-15 subjective utility variables from the World Value Survey were considered. DATA & METHOD DATA The data which was collected from the Internet was put to perform regression analysis to find out whether there exist some relationship between number of restaurants, mean life satisfaction and number of individuals. Table 6 shows that there is a weak correlation between these three variables which is depicted in the correlation matrix therein. Hence it is assumed that there exists no herteroscedasticity present. So the regression equation which represents the dependent variable as mean life satisfaction by keeping number of restaurants and number of individuals can be a reliable one. Heteroscedasticity is expected to affect the actual regression which is otherwise a plausible measure. Here, the first data set is the number of Restaurants locations in developing countries. This data was obtained from country specific Restaurants International websites. To determine which of the 54 countries in the CVS study should be included, developing country was based on the definition from the World Bank’s Atlas: a developing country is one whose per capital gross national income (GNI) is $12,195 or less (World Bank, 2009). This resulted in 35 countries (a total of 384 regions within these countries) meeting criteria for inclusion in this study. The survey involved 77,000 respondents with 58,770 respondents living within those developing countries (CVS, 2009). The data included only countries identified in the WVS study as a developing country. The total number of Restaurants in each region and city listed in the WVS study were carefully counted from each website and reflects an accounting for all open and running locations in January 2011. Since data set is to include the construction of new Restaurants locations takes on the store number of the previous, shut down locations, it was difficult to obtain an exact number of locations for the data set used in this analysis. Therefore, by reading archived newspaper articles many locations that opened or closed since 2008 were identified and the numbers adjusted accordingly. Then, the results for the WVS study for each region of each developing country was paired with the total number of Restaurants locations in each region. As Table 2 shows, of the 35 developing countries, Ghana, Burkina, Ethiopia, Mali, Rwanda, Zambia, and Iran have no Restaurants locations. Of the 384 developing regions, roughly half have at least one Restaurant, with Guangdon province in China having the most at 351 Restaurants locations. The variable RESTAURANTS represent the open Restaurants locations in the countries listed in Table 2. The second data set is the dependent variable LIFE SAT (life satisfaction) from the WVS. In the survey, people answer the question: “All things considered, how satisfied are you with your life as a whole these days?” using a 10-point scale ranging from “(1) dissatisfied” to “(10) satisfied” (WVS, 2009). The third data set taken from the WVS and, for the purpose of this study, is called subjective utility variables (SUV).  These independent variables taken from the WVS, make up a measurement to estimate life satisfaction by using both subjective variables (views on family, politics, trust, religion, leisure, children, education), and using demographic variables like age, gender, and marital status.  Much of the literature supports the interchangeability of life satisfaction, happiness, and subjective well-being.  By using the SUV variables, the results of this study should support previous research (in terms of signs, etc) and be similar to the life satisfaction variable results. See Table 1 for information on the questions surveyors asked and the rating scale used on these variables. METHOD Many of the empirical happiness studies used probit and Poisson models because of the nature of the dependent variable defined on a 10 point scale (Rampichini et al & D’Andrea,1988; Litchfield et al, 2010; Tao, 2005). Furthermore, the results from these studies do not vary significantly between OLS with robust standard errors and probit/Poisson (Stevenson & Wolfers, 2008). However, to confirm there was no difference between the Poisson and LOS models the data was run using the Poisson model (see Table 4 column 3). As expected, the results were similar therefore; the OLS statistical model was selected for this analysis. To observe the impact of the number of restaurant locations in each region listed, REGION, INCOME, and HIGHEST EDUCATION were held constant. Furthermore, to examine the income effect, the LIFE SATISFACTION variable was regressed on the explanatory variables at different levels of income. The baseline model used was run in OLS with robust standard errors. The model is: where i denotes a particular individual, j is a given region, and ?j accounts for all regions in the study. ??ij is a vector of all independent variables as shown on Table 1:Variables from World Value Survey. REGION is fixed and not shown in the regression results. The independent variable RESTAURANTSj shows the impact of each additional RESTAURANTS on an individual’s life satisfaction. The eij is is the error term. Heteroskedasticity is an expected finding because of the large difference in sizes. See Table 3: Summary of Descriptive Statistics for results. Three regressions were run. Referring to Table 4, in the first regression column (2), all the independent variables (see Table 4), except Restaurants, were included in the analysis to determine the impact each one has on life satisfaction. The income variables were run by omitting the first income bracket (dummy variable), with the second income bracket making the individual happier than the first, and so on. The second regression set used the same independent variables as the first, with the addition of Restaurants locations in each region. RESULTS The OLS model with cross-country fixed results show a small but statistically significant positive correlation between Restaurants and life satisfaction. This means that for each additional Restaurants fast food restaurant location in a region, makes the individual 0.056 more satisfied with their life (converting to a percentage it is about 0.2%, therefore, the coefficient size is used). Regarding income, a positive and significant effect on life satisfaction, paralleling previous income research, until the eighth level (Sarracino, 2010). When comparing incomes, the addition of restaurant locations, the results supported previous research by Sarracino (2010) in that, income continues to increase and levels off at the 8th income level then starts to increase in the 9th and 10th level but at a lower rate than the 8th level. This could be because in developing countries, individual income levels increase substantially, but still not cause an increase in material norms (James, 2000). It could also be explained by preference drift, meaning the individual preferences have already gone beyond their income level, suggesting that after a certain point it does not have as large of an effect (James, 2000). The rest of the supporting subjective utility variables have the same positive signs (with the exception of age being negative) as previous literature and parallel results from column (2) on Table 4 (Helliwell, 2004; James, 2000; Diener & Biswas-Diener, 2002; Easterlin,1974). Age is negative as expected; therefore, it is squared to account for the U-shaped aspect discussed in previous literature, which states that individuals are happiest at their youngest and oldest ages (Helliwell, 2004). Although the study is involved in finding relationship between life satisfaction as dependent variable and no. of individuals, no. of restaurants as independent variables, yet a strong relationship between these variable could not be established due to so many other extraneous variables which may be present and beyond our hands. Those may be geographical location, timings of the restaurants and other ethical factors (which may be unknown). The real influence of life satisfaction may be based on the other extraneous variables beyond the scope of this studies. A future approach may evolve involving some other variables which can be taken into consideration by some influencing factors taken for some pilot study (which we, researcher may feel less important but the customer feel more important, for example washing facilities and rest room facilities may be some of those). 2: Number of Restaurants Locations per Country Table 2: Table showing countrywise number of regions and number of locations Country No. Regions No. locations Mexico 3 287** S Africa` 8 131** Argentina 3 160* Brazil 19 574** Chile 4 67** India 18 183* Bulgaria 9 28** Romania 39 63* China 24 1051* Turkey 9 155** Ukraine 4 68** Peru 16 21* Uruguay 32 18* Ghana 8 0 Moldova 3 3* Georgia 10 5* Thailand 3 130** Indonesia 10 88* Vietnam 7 0 Serbia 4 14* Egypt 22 50* Morocco 9 12* Jordan 1 16** Guatemala 4 72** Trinidad 0 0 Malaysia 13 153* Burkina 8 0 Ethiopia 5 0 Mali 6 0 Rwanda 12 0 Zambia 9 0 Russia 7 219* Columbia 6 103* Iran 30 0 Iraq 18 1*   3672 total *Restaurants present   **Restaurants present in all regions --all regions listed in WVS for developing countries Table 3: Summary Descriptive Statistics Table 6: Table showing inter correlation between no. of restaurants, mean life satisfaction and no. of individuals.   No. of restaurants Mean Life Satisfaction No. of Individuals No. of restaurants 1 Mean Life Satisfaction 0.1844 1 No. of Individuals -0.1696 -0.256 1 Table 7: Table showing regression output keeping independent variables as no. of restaurants, no of individuals and dependent variable as mean life satisfaction Multiple R 0.29326208 R Square 0.08600265 Adjusted R Square 0.04626363 Standard Error 0.70100942 Observations 49 Table 8 ANOVA for Regression Source of variation df SS MS F Significance of F Regression 2 2.127 1.06351209 2.1642 0.1264 Residual 46 22.605 0.491414204 Total 48 24.732 Table 9: Table showing the coefficients to explain regression equation Variables Coefficients Standard Error t Stat P-value Lower 95% Upper 95% Intercept 6.92777922 0.135152778 51.25887384 3.11E-42 6.655731 7.199828 No. of restaurants 0.00151458 0.001492581 1.014739071 0.315538 -0.00149 0.004519 Number of Individuals -8.898E-05 5.50019E-05 -1.61780863 0.112541 -0.0002 2.17E-05 Read More
Cite this document
  • APA
  • MLA
  • CHICAGO
(“Restaurants and Happiness/Life Satisfaction Statistics Project”, n.d.)
Retrieved from https://studentshare.org/statistics/1421110-restaurants-and-happinesslife-satisfaction
(Restaurants and Happiness/Life Satisfaction Statistics Project)
https://studentshare.org/statistics/1421110-restaurants-and-happinesslife-satisfaction.
“Restaurants and Happiness/Life Satisfaction Statistics Project”, n.d. https://studentshare.org/statistics/1421110-restaurants-and-happinesslife-satisfaction.
  • Cited: 0 times

CHECK THESE SAMPLES OF Restaurants and Happiness/Life Satisfaction

A company that provide great customer service in its industry

The reason that McDonald's has been a name in the restaurant industry for such a long time and… It is a known fact that fast food restaurants are dominating different sectors of the American society and not only that but the rest of the nations as well.... To start with, McDonald's has been a name of benchmark all over the world when it comes to the restaurant industry and the same has been the case for quite a few decades globally....
4 Pages (1000 words) Essay

Labour Turnover and Customer Service in Restaurants

The results indicate that there is a relationship between the employee turnover and customer satisfaction.... nbsp;The customer satisfaction is related to the level of services employee is able to provide.... This is a service industry where the intangibility, inseparability and heterogeneity of the service make it very challenging for the service provider to maintain consistency and increase the level of satisfaction received by the consumers....
42 Pages (10500 words) Essay

The Motivational Factors That Affect Workers

The main aim of the dissertation "The Motivational Factors That Affect Workers" is therefore to identify the various motivational factors for the employees of a Michelin rated restaurant as Michelin rated restaurants normally have a highly motivated workforce.... Studies reveal that Michelin rated restaurants normally have a highly motivated workforce, and that is the reason as to why they are rated under the Michelin guide.... This study is important because it analyses this aspect of motivation, in relation to Michelin rated restaurants....
39 Pages (9750 words) Dissertation

Factors Affecting Growth of Restaurant Business in Nigeria

ost of the Nigerian restaurants and fast food chains are international brands though Mr.... nbsp; restaurants may be divided into a high-end restaurant, hot spots, budget restaurants, local favorite food restaurants, etc, however, most of them come from renowned international food chains....
24 Pages (6000 words) Research Paper

McDonalds Strategic Management

McDonald's, promoted by Ray Krov is the largest fast food restaurants chain in the world and is also the most popular brand worldwide.... This paper is an attempt to analyze the strategic structure of McDonald's with external and internal environment assessment.... How its business strategies are affected by different factors and how they have been successful forms the core of this report....
8 Pages (2000 words) Assignment

Hospitality Food and Beverage

idscale food and beverage establishments are also known as casual service restaurants and are usually small in size, with the limited range of menu.... Midscale restaurants mainly highlight three factors such as food-service quality, family price-value, and time convenience....
7 Pages (1750 words) Assignment

Food and Beverage Production and Service Systems

The author gives the characteristics of food production and food & beverage service systems, discusses factors affecting recipes and menus for specific systems, compares the cost and staffing implications for different systems and examines the financial controls used in food and beverage operations… Equipment and Storage facilities – limited storage facilities in most restaurants, hotels and most kitchens often prevents the inclusion of most perishable foods in the menus and recipes....
9 Pages (2250 words) Assignment

Motivation and Michelin Rated Restaurants

Motivation is, therefore, is important factors that contribute to the quality of a restaurants cuisine, and hence determine whether a restaurant will receive, one star, two stars, or even three stars.... The other interest emanates from the quality of guests that Michelin rated restaurants serve....
27 Pages (6750 words) Dissertation
sponsored ads
We use cookies to create the best experience for you. Keep on browsing if you are OK with that, or find out how to manage cookies.
Contact Us